April 29, 2011by Mark Rose- 0 comments
Perfecting your entry level

Eleven thirty in the morning on Friday 29th April – if you weren’t invited to Westminster Abbey today, or simply couldn’t chose between hearing the ceremony blow-by-blow from Fearne Cotton on the BBC or Paul Burrell on Fox – welcome to Trader’s Bulletin!
Despite a treacherously short working week, sandwiched between more Bank holidays that you could shake a stick at – I’ve got some sound technical stuff for you this week – with immediate practical applications for your trading.
Don’t accept slapdash entries
If you’ve ever hung around waiting for confirmation before entering a trade, only to watch your profit potential get eaten away – then this tip will help you hone your trade entries.
One of the most important things in trading is your entry point. A good entry point leads us to profit; a bad entry point leads us to losses. It’s all very well trading with the trend, and waiting for confirmation of that trend before we commit our funds. But that’s not enough – we need to know where to enter a trend.
Over the past couple of months, we’ve looked at moving averages and what excellent tools they can be for judging trends. We’ve also gone into the drawbacks of false signals, and how to get confirmation of a trend by adding more moving averages. (For details on this, see the example given in “A DIY Trading Strategy”[LINK: https://www.tradersbulletin.co.uk/page_56.html])
However, waiting for the 10-day moving average to hit the 50-day moving average means sitting on your hands while the market moves in your favour, without accumulating any of the profits.
So, today I’d like to look at a tool that can give you faster answers when it comes to confirming a trend …
Adding an oscillator
What I’m talking about is the Relative Strength Index.
If you haven’t used RSI before, it’s a momentum oscillator and is usually added as a line below the main body of your chart – something like this …
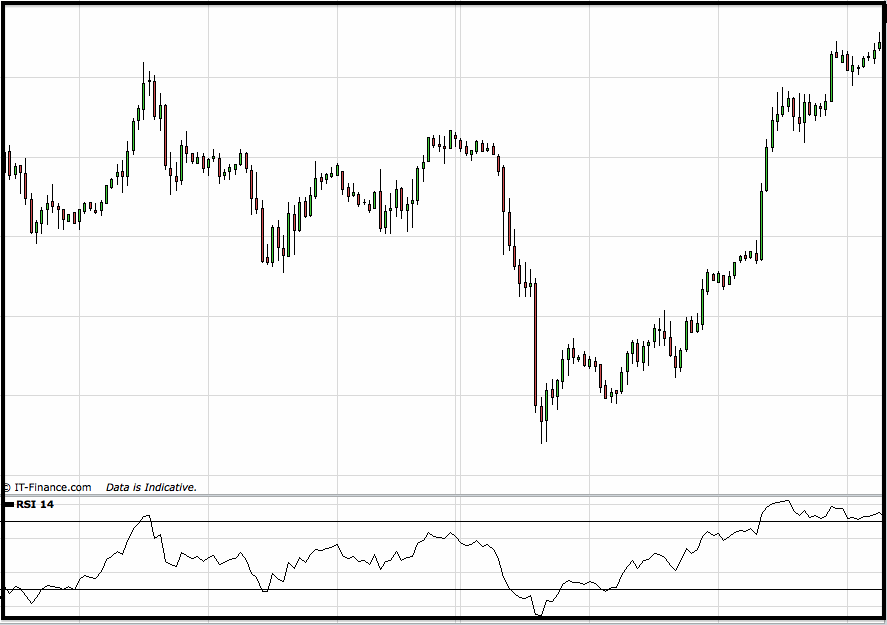
Many people use this tool to determine overbought or oversold conditions – if it’s below 30, the market is considered oversold and is due a correction; if it’s above 70, the market is considered overbought and is due a correction to the downside.
What is often overlooked by traders is the value of the RSI in confirming trends.
So, let’s say that we’re using a double moving average crossover strategy – waiting for buy signals when the 7EMA crosses above the 21EMA; and sell signals when the 7EMA crosses below the 21EMA.
To confirm our signal, rather than pop on a longer-term EMA (of say 50), which means waiting longer for our entry, instead we’re going to look for confirmation from the RSI …
If the RSI is above 50, we have confirmation of an uptrend. If the RSI is below 50, we have confirmation of a downtrend.
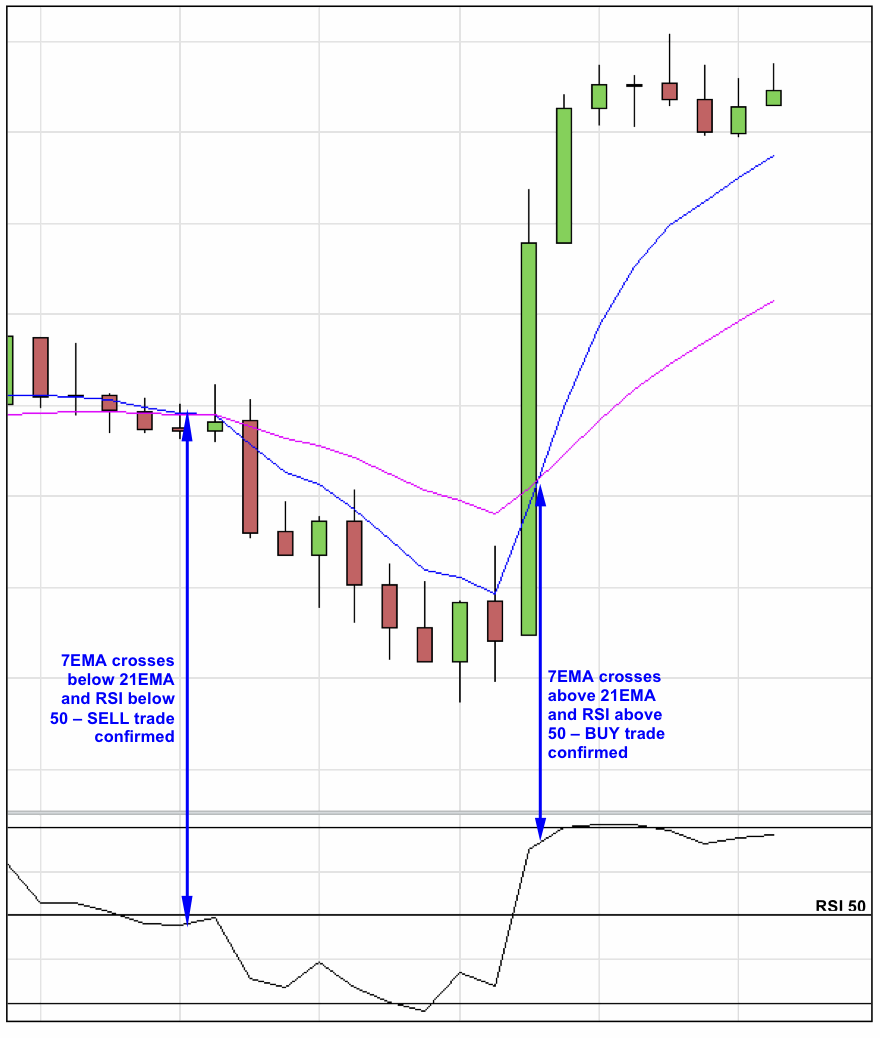
By adding a simple filter like this to your entry point, you can greatly reduce the number of false whipsaw trades you end up in.
But remember, more is not necessarily better – constantly adding more and more filters to your trading strategy won’t make it a better one – you’ll just end up with too many or too few trading signals.
None of these filters will make your system infallible – just go with the ones that work best for you, and give them a chance to pan out before making more changes.
Until next week,
Mark Rose