September 14, 2018by Mark Rose- 0 comments
Support and Resistance Trading Tricks
Arguably one of the most reliable pieces of technical analysis, yet support and resistance levels are belligerently ignored by many traders.
The problem with support and resistance levels is that there’s no one-click button on your platform to apply them – you’ve got to look at the charts yourself, and then there’s a level of wooliness that creeps in.
But we’re ignoring these levels at our cost, so I want to look at some very simple, easy ways to add S&R to your charts, and to build it into your trading routine …
Why support and resistance matters in your trading
Just a glance at any price chart will show you that prices don’t move in straight lines. Instead they bounce around and bunch up in what look like chaotic patterns.
But, if we learn to recognize these behaviours, we can start to make sense of these moves. I’m not suggesting that we’ll know what prices will do … but we can make some predictions about how they might behave at key price points.
What we’ll see is buyers coming in again and again at the same price point, forcing prices higher … we’ll see selling frenzies repeating themselves at key levels, where traders want to realise their gains. We’ll also see congestion around these levels, if there’s indecision about whether prices can force through breaking these areas of support and resistance …

These lines of support and resistance have a powerful effect on price, drawing prices towards themselves (because these are the areas are littered with buy and sell orders), and also causing prices to surge away from them, as these orders get hit.
Common mistakes with support and resistance trading
If you look in text books or across the internet, you’ll find lists of ‘crimes’ committed by inexperienced (and experienced) traders drawing their s&r lines in the wrong places.
You’ll find rules about how many touches a level needs before it counts as support or resistance … about how recently it needs to have been touched … about whether wicks count or should be ignored …
I’m going to suggest that we stop worrying so much about getting our levels in exactly the right place, and just start using these levels (even if they’re not perfect – you’ll probably have noticed that markets aren’t exactly perfect at following rules anyway!)
Three shortcuts to drawing S&R levels
1 • Longer timeframe
The first trick with drawing support and resistance lines is to switch your timeframe. If you usually trade on hourly charts – switch to daily; if you trade on a 5-minute chart, switch to hourly.
Use the longer timeframe to draw in your support and resistance levels, then come back to the chart that you usually trade.
This will make it considerably easier to see the ‘big picture’, as it’s easy to get bogged down in the detail when looking at your normal charting timeframe.
2 • Line chart
If you’re still struggling to get a clear picture of where support and resistance are falling, switch your chart from candlesticks to a line view.
You’ll no longer have to worry about what’s a wick and what’s a candlestick body – because you’ll just see the price movements in a much simpler format.
3 • Donchian channel
If the support and resistance levels are still evading you … here’s a cheat.
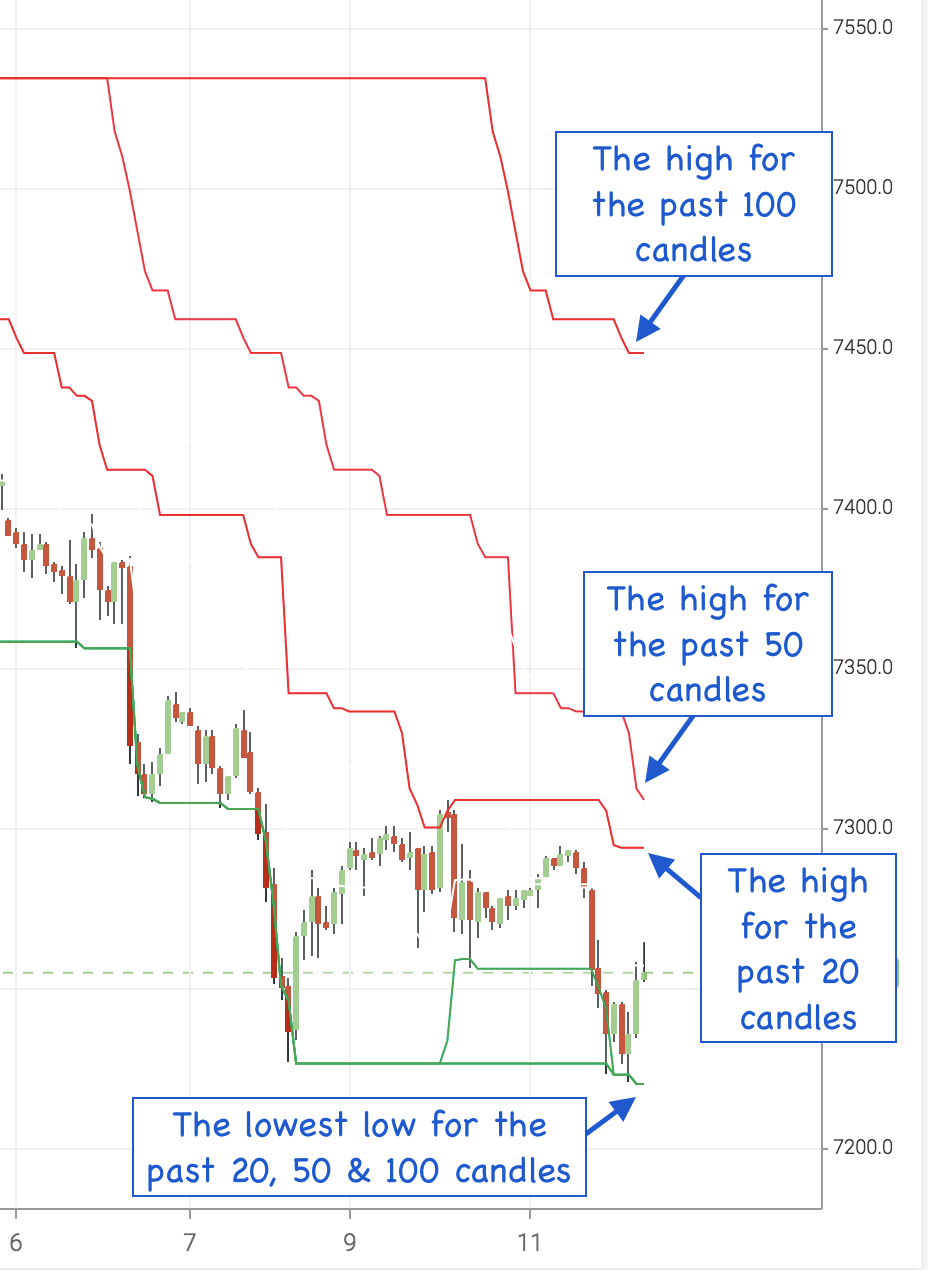
Applying a Donchian channel indicator to your charts will plot recent highs and lows, and by adding a few of these lines to your charts, you can build a picture of where turning points are.
The Donchian levels will only show you the highest high and the lowest low of the past ‘x’ number of candles. Here I’ve added Donchian channels for 20, 50 and 100 periods. It looks like this …

Obviously, these won’t be identical to support and resistance levels drawn by hand, but they are definitely a useful tool if you’re not confident drawing in lines, or if you need an easy automation.
So, now you’ve got some S&R levels, here’s how you can use them …
Three great S&R trade setups
One of the most popular ways to trade off support and resistance levels is to look for bullish candlestick patterns on a support level, or bearish candlestick patterns on a level of resistance. But I’d like to show you some less-conventional set-ups that are very powerful when they come along …
1 • One-hit trampoline trades
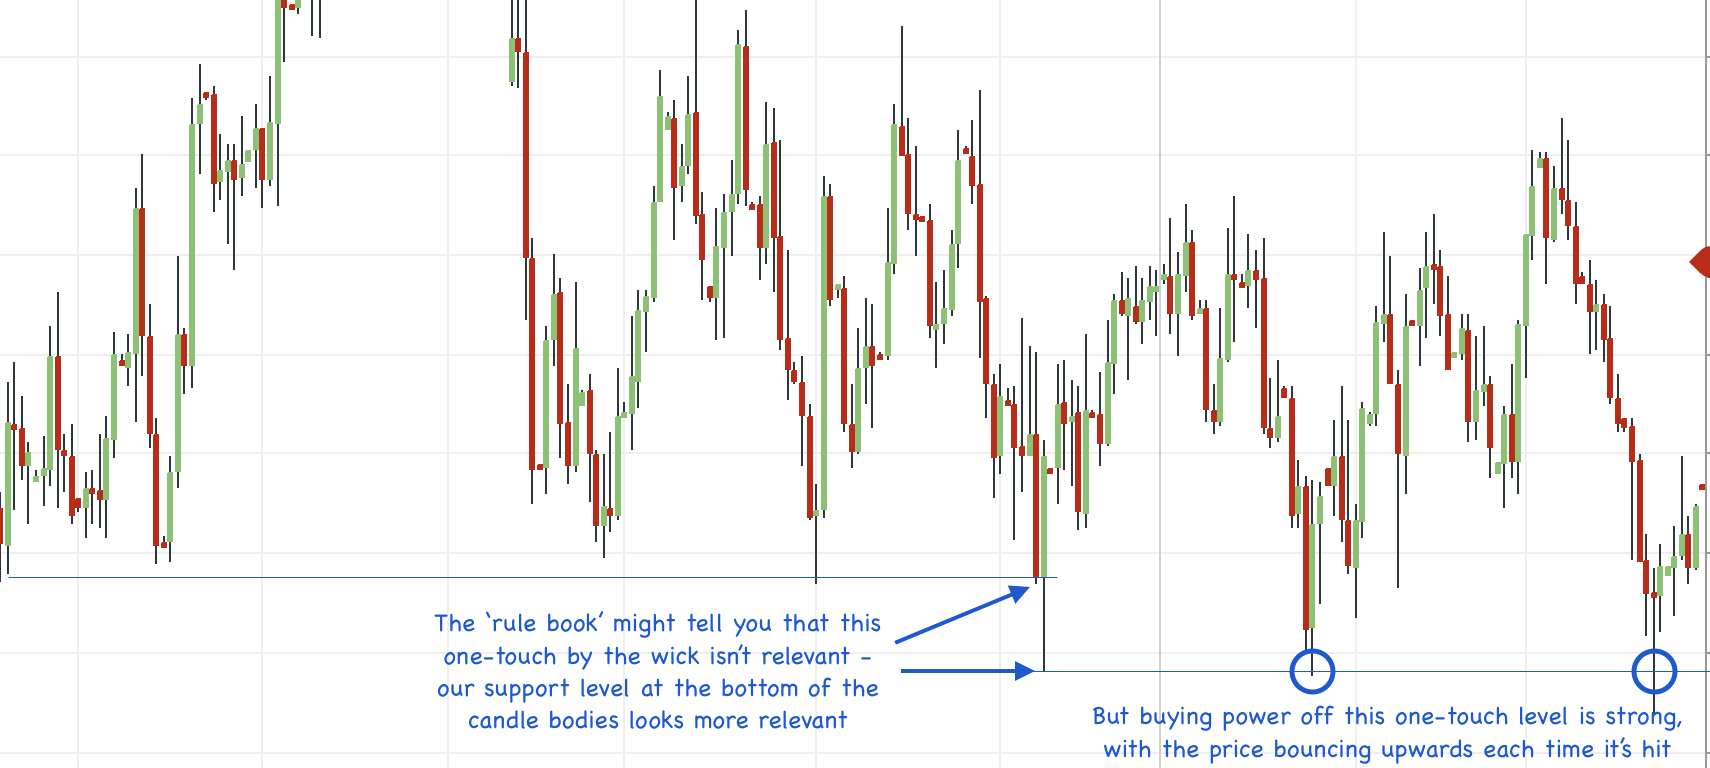
Conventional ‘wisdom’ tells us that that a level of support or resistance is stronger the more often it’s been hit.
It also tells that we should ignore those sporadic wicks that mark erratic trading behaviour.
Now I’m going to suggest the opposite …
Let’s think about what’s actually happening at these levels. Where we have multiple bounces off a key level, we can expect these price areas to be littered with buy and sell orders, as the buyers and sellers battle it out – which is why they have a lot of consolidation around them.
But where we have one-touch wicks, with prices powering away from these levels – this means that, if support is really strong here, then buyers are strongly dominant. Likewise, if the price powers off a one-touch resistance levels, then we can see that sell orders are dominant here.

2 • Double-up levels
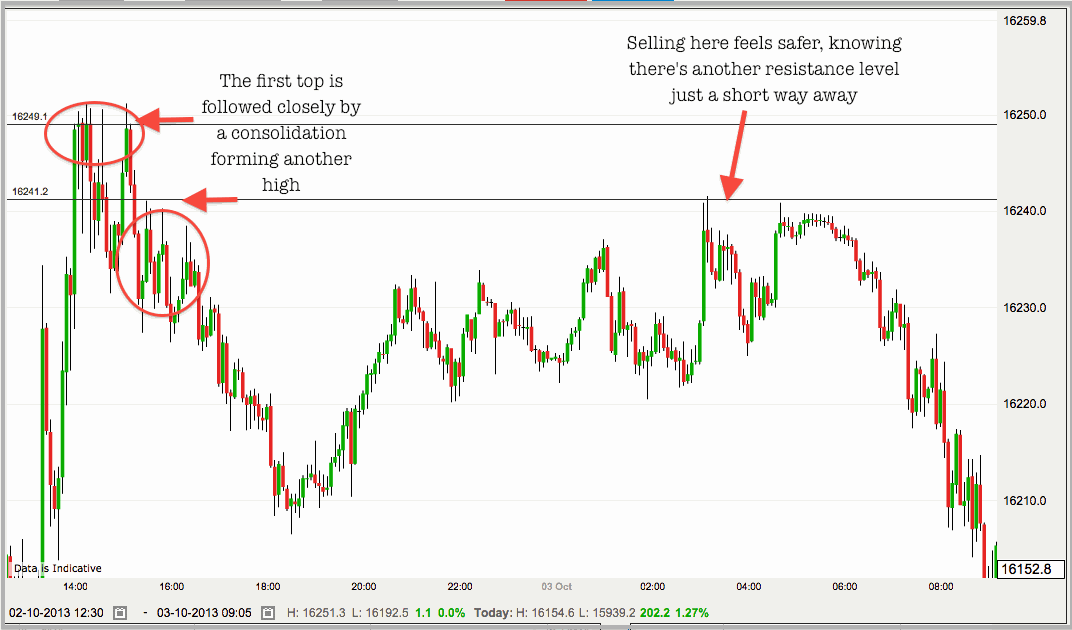
This S&R set-up happens when you have two support or two resistance levels right behind each other.

In the example above, we can see the sellers piling in at the 241 level. But we also see another line of sellers queuing up at 249. This increasing the chances that the price will turn again around these levels, but it may not reach as far as the higher level.
Traders can use this information to sell at the lower level, confident that there are sellers above them – plus, just beyond that, there’s the perfect spot for a stop level. The result can be a high-probability trade, with a good risk-reward ratio.
3 • The whiplash
Of course, prices don’t always bounce off support and resistance levels … sometimes they break them. And that’s where this trade set-up comes into play.
Breakouts can be really powerful market plays, because they can have tight stop distances and wide open profit targets. But false breakouts can be expensive. The whiplash set-up doesn’t trade from the breakout, but waits for the price to rebound to the level of support or resistance and then breakaway a second time.

Or this …

Incorporating support and resistance in your trading
The trick with using support and resistance levels to improve yoru trading performance is to try to see them in terms of buyers and sellers. These are the pinch points where buy and sell orders stack up – and if we can know where other trades will be acting, we can keep a step ahead of them.
To enjoy more content and get it faster