September 11, 2015by Mark Rose- 2 comments
This VIX index reading is unprecedented
20% of the worst stock market crashes occurred in the last month [source].
That’s 2 out of the 10 biggest falls.
Add to that the Fed rate decision due in the next week …
And it’s little wonder that we’re experiencing some unusual trading conditions.
But with the markets, there is no ‘normal’ – as traders, we need to be ready for these twists …
Never, ever, have we seen a reading like this on the VIX Index …
The VIX, or Fear Index as it’s sometimes known, is the CBOE Market Volatility Index.
First established in 1993, it is calculated on a weighted blend of prices for a range of options on the S&P calls and puts. Generally, traders will buy put options as insurance when they are worried about market conditions. So, when lots of traders are worried, the price of these put options goes up – and the VIX index level measures this. So, in essence, it is a gauge of investors’ confidence in the market.
The VIX index, in general, has an inverse relationship to the market. The VIX goes up as stocks decline, and the VIX declines as stocks advance. A low VIX means that traders are confident about market conditions. A high VIX means that they are fearful.
This chart shows how the two instruments correlate to each other …
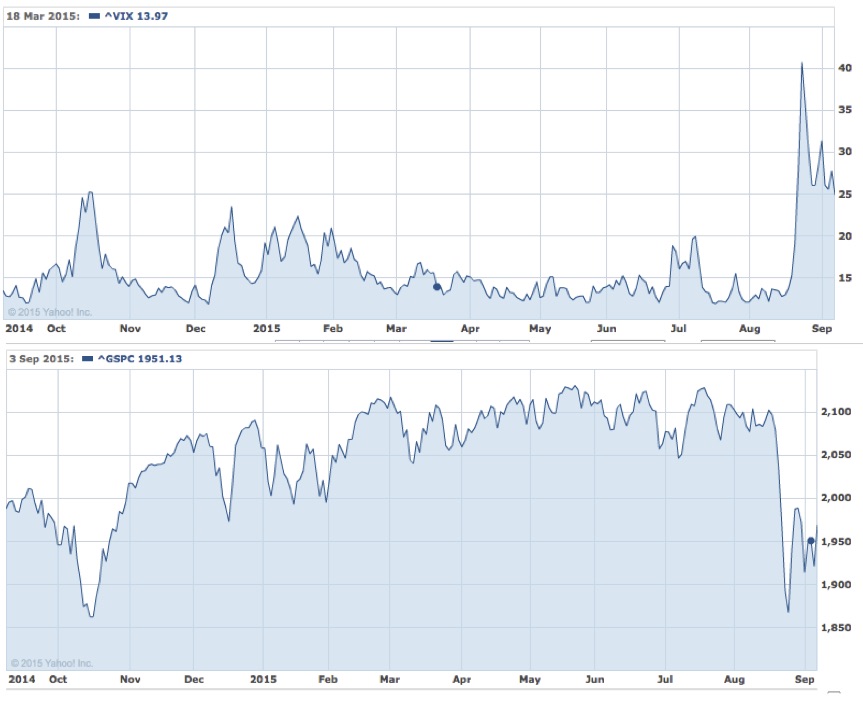
When the VIX spikes up, we see a fall on the S&P; and when the VIX drops, the S&P rises. Generally speaking, the VIX likes to hover between 10 and 15 … a number in the mid-20s indicates mild concern … the 30s implies fear … and the 40s represents market panic.
As you can see, the end of August saw the VIX spike above 40 – the market equivalent of running around screaming while wearing a tin-foil hat.
Many traders use the VIX as a hedge against future falls in the stock market – that way, if they lose on their stock market investments, they’ll make up for those falls by gains in the VIX.
But what’s unprecedented is this …

This chart shows a record number of speculators long the VIX, plus investors short on the S&P to levels not seen since 2012.
So, what does this mean for us?
We can expect a very volatile September – when the VIX is up in this range, it tends to swing about a great deal, so it’s not unusual to see large, single-day moves.
And, of course, there’s that Fed decision …
Let’s have a think about that Fed rate …
The Fed rate was moved to 0% in 2008 during the worst recession since the Great Depression. The US economy has been growing, albeit slowly, since June 2009, and economic data gives us no justification to hold the rate at the same level is was at the depth of the financial crisis, when unemployment stood at 10%.
However, the Fed is not just looking at economic data – they’re also watching the stock market. In 2010 and 2011, when the Fed was poised to raise rates, sharp falls in the markets and spikes in volatility caused them to bring in quantitative easing.
And now, in 2015, while the stock market watches the Fed for clues as to which way to move, again the Fed is watching the markets for clues as to which way to move.
It’s not clear whether the dog is wagging the tail … the tail is wagging the dog … or whether the dog has chased, caught and eaten the tail altogether.
The result seems to be a huge one-way bet from speculators – down on stocks, up with the VIX. It shows a market that seems to have run out of ideas, where the influence of central banks has left investors with no fundamentals to rely on.
But as investors, we quickly learn that there are no ‘normal’ trading conditions – with every month the market throws new situations at us, and a new ‘record high’ on some measure.
High volatility can offer up a trader’s paradise, with huge swings that we can take advantage of. But as anyone who’s been in the market in recent weeks will know, that this is no place to be without a hedge.
The problem with the VIX hedge
The difficulty with hedging is matching up your trades accurately, and the VIX doesn’t help here – despite large market swings, the movement on the VIX can be very subdued. That’s why I’d be wary of jumping into any VIX product. There are simpler ways to hedge your trading, as I’ve explored in earlier posts.
But the wise trader will know where the VIX is, and be watching which direction it’s moving in. The VIX is like a rubber band – it stretches and pulls one way or another, but has a natural tendency to move back to its ‘neutral’ position. A low VIX isn’t a sign that all is well in the markets – it could be a signal that the market is too complacent. Likewise, a high VIX needn’t send us into panic mode – fearful markets tend to be more cautious.
And as for ‘unprecedented trading conditions’ – we need to get used to trading in these.
To enjoy more content and get it faster








2 comments
David
very helpful, were do we find the VIX,
Many thanks. David Milburn
Mark Rose
Hi David, sorry for slow response i somehow missed your comment. You can find VIX chart here:
finance.yahoo.com/echarts?s=^VIX
You may also find it on your trading platform, but this will be a futures price, so won’t show much history. Interestingly, there was a big fall off on the VIX last night – it began falling AHEAD of the Fed meeting.