3 simple rules to read candlesticks without learning a single pattern
Ultimately all successful trading is about watching what others are doing, and acting on it before the crowd get in.
This is just as true if you’re buying a rising market – you need to spot the opportunity and get in before other buyers have depleted the market – as it is of trading reversals.
And, without doubt, the most powerful way to get a snapshot of market sentiment is by reading candlesticks – there’s more information in these little shapes than there is in a mile of newspaper column!
These simple rules will enable you to read candlesticks without having to learn a single pattern …
1. Compare the range
Here it all comes down to size. The scale of the candlestick is a really good indicator of just how many traders are active, and what kind of power is behind any move.
If you look at the red candlestick circled in the image below …
Sure, the sellers may be in control here, but just how many of them are there? The size of the candlestick is larger than the three before it, but it isn’t significantly bigger than the moves we’ve seen recently.
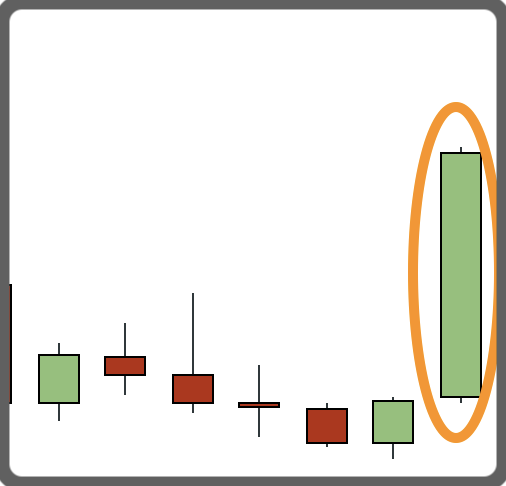
By contrast, in the candlestick circled below, the buyers are in control, but we can see there is significantly more power behind this move than we’ve seen in the candlestick periods running up to it …
2. Who’s in charge
The way to measure this is incredibly simple – where did the price close within the range?
The lower within the range the price has closed, the more control the sellers have. The higher within the range the price has closed, the more control the buyers have.
If the body of the candlestick is relatively short compared to its range, then we shouldn’t get to fixed up on the colour of that candle – the wicks become more important.
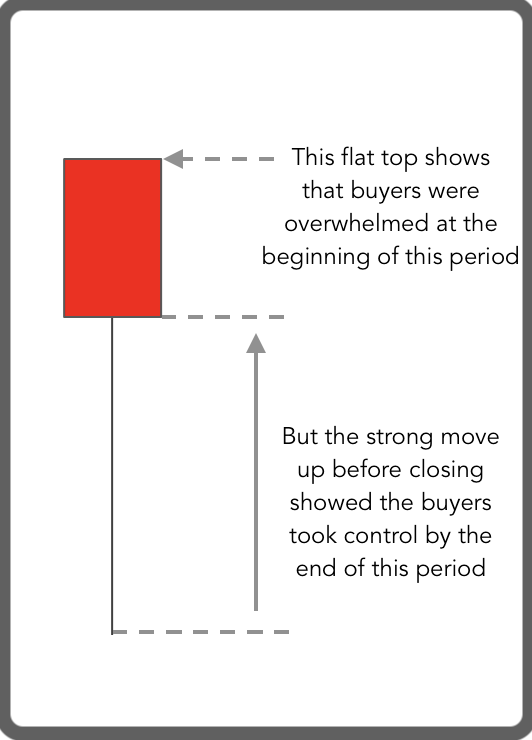
But if we have a flat top and/or bottom to the candle, this gives a strong information about who is in control at the beginning and/or end of that period …
3. How it fits with its neighbours
The final trick is to look at your candlestick in the context of its neighbours. This can help to see the wood for the trees when you’re staring at a row of candlesticks bobbing up and down and trying to get your head around which way sentiment is driving.
This isn’t about spotting clever patterns, but instead about thinking how those candles would look if they were combined into a longer timeframe. (If you find this tricky to visualise, you can always just switch your chart to a longer timeframe, which will do the job for you.)
Here are a couple of examples …
As you get used to viewing candlesticks this way, using these three rules, you’ll move away from ‘pattern hunting’ and trying to remember what each pattern is telling you – and instead you’ll looking at charts and intuitively seeing market sentiment spelled out.
It’s a simpler, faster and much smarter way to use charts.