May 2, 2014by Mark Rose- 6 comments
Enter trade here! Simple messages from extreme candlesticks …
Candlesticks with flashing red beacons on to tell you when to pay attention – isn’t that what we all need on a chart?
I’m pleased to see that Bulletin members have been as excited about these new-style extreme candlesticks as I have.
If you missed the intro to these last week, you can catch it here.
In short, these candlesticks tell us where the action is going on. Just because a candlestick is short, doesn’t mean it hasn’t been a hive of close-fought activity. These ‘extreme candlesticks’ flash red at us when activity is high. They show blue when it’s low (green for normal activity levels).
Here’s an example taken from the 15minute cable chart earlier this week that shows how they work …
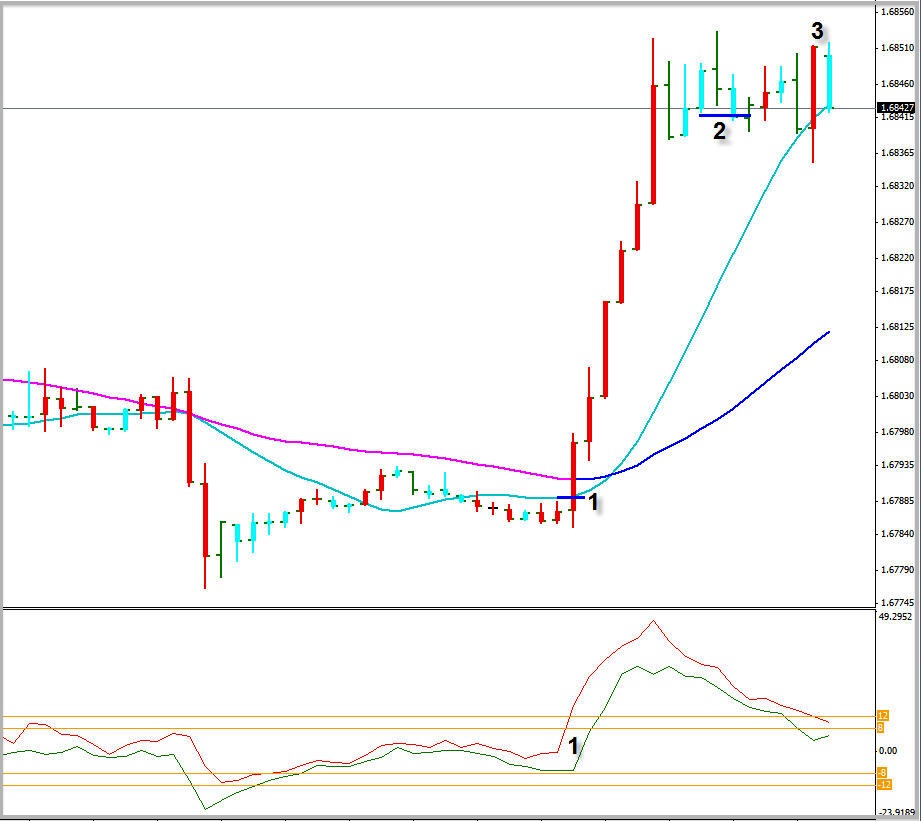
Let’s go through what’s happened here.
Remember, on these candles, red means extremely high activity levels and blue means extremely low activity levels.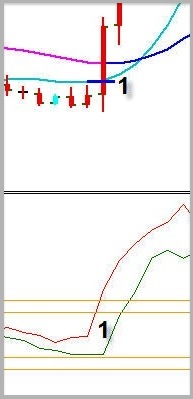
I’m going to zoom in on the area around 1.
First, note how selling has tailed off in the blue low-activity candlestick.
This is then followed by two short high-activity red candles.
Remember how last week we talked about how these short red candlesticks were like ticking timebombs, waiting for the price to explode out.
Add to this the sudden upswing shown on the oscillator at the foot of the page.
So, we’re looking for a big move higher – a big up candlestick that will engulf the previous short one. And that’s exactly what happens. We’re able to enter a trade at 1, just as the new candlestick is engulfing the previous one (we don’t need to wait for this candlestick to close).
And we’re rewarded with a very strong move higher.
But that’s not all …
These extreme candles also do a good job of telling us when that move is running out of steam.
Let’s see how that trade played out …
Note how the low-activity candles around 2. show that the bullish move has really run out of steam.
We get a high-activity bullish engulfing candlestick at 3. However, this has the odds stacked against it for a number of reasons:
• We’ve already enjoyed a substantial move on Cable – this extra up-side would require the instrument to move beyond its average range.
• This doesn’t have the same explosive ‘timebomb’ set-up.
• other indicators aren’t telling us to get in here
That final point gets the nub of all candlestick trading – whether it’s conventional candles or these extreme candles. Context matters. We need to look for the right candlesticks in right place. Extreme candles are an important tool – but they’re not the whole picture.
Which is why, on Tuesday next week, I’ll show you how you can put these exciting candles together with the missing components to make this into a very useful strategy.
Please watch out for my email next week …








6 comments
Roy
May be an age-related problem, but I am unaware of the location of these candles. Seems just the ticket, but still confused.
Roy.
Mark Rose
Promise to bring you full details on how you can start using them next week. Keith – take your point on colour-blindness. Not sure if the colours can be adjusted – I’ll look into this. Hope you enjoy the long weekend
Keith
Its no so good for us guys with red-green colour blindness! Although IG’s red & green are easily distinguishable – not Capital Spreads the last time I looked.
mohan
can this be written into an algorithm for signal to trade as at no 1 blue line for entry
Dave
So where do we find these candles?
Guy
Completely converted to these new candles! – look forward to hearing more