Now I want to look at the flipside – getting more secure investment options.
Trend trading is largely regarded as the ‘sensible’ choice, but the question the trend trader always wants the answer to is: is this instrument in a trend?
If it is – we can make money.
If it isn’t, we’re likely to get tossed out of trades.
If there was only an indicator switch that would tell us when the trends are on or off …
Well, that’s exactly what we’re going to look at here.
I’ve got two tools to show you. One is an on/off switch, and the second gives you a percentage of certainty on the trend, enabling us to only pick trend trades with a 95% certainty.
Trend on/off sign
Many trend indicators will tell you if the trend is up or if it’s down … but that misses out the crucial bit of information.
We need to know if the trend is just NOT there.
A lack of direction can be very expensive for the trend trader, and the ADX filter warns us off weak markets.
Here’s how it works …
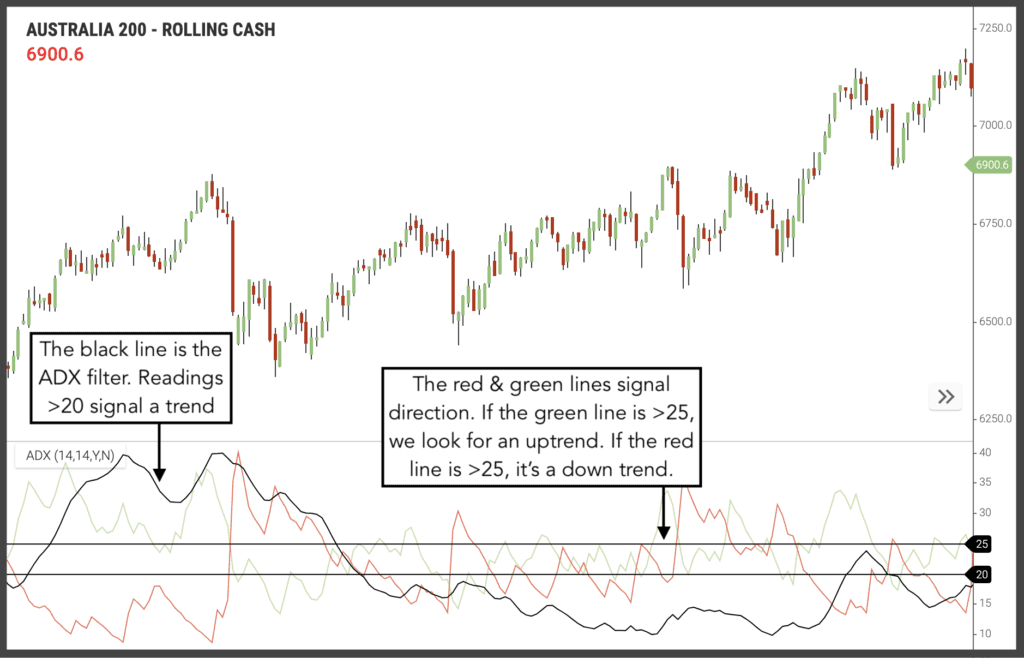
The Average Directional Indicator takes the form of 3 lines: +DI, -DI and ADX
The +DI and -DI lines are usually green and red, respectively. If the red line is above the green line, it indicates that the down trend is dominant; if the green line is above the red one, it indicates that an uptrend is dominant.
But what’s crucial is that we know whether that direction is strong enough to act on. So we have further criteria:
The +DI or – DI must read higher than 25
AND the ADX (the black line) must be greater than 20.
By demanding these extra criteria, we can keep ourselves out of weak, lackluster trends.
But what if you want a higher level of certainty than this?
Pushing your demands to 95% certainty
Entering a trending market is often about getting in on the pullback, so you have maximum potential as the price moves back in line with the longer term trend.
And that’s exactly what this indicator tool can help with – adding a 95% confidence score to your entry signal.
It’s about linear regression.
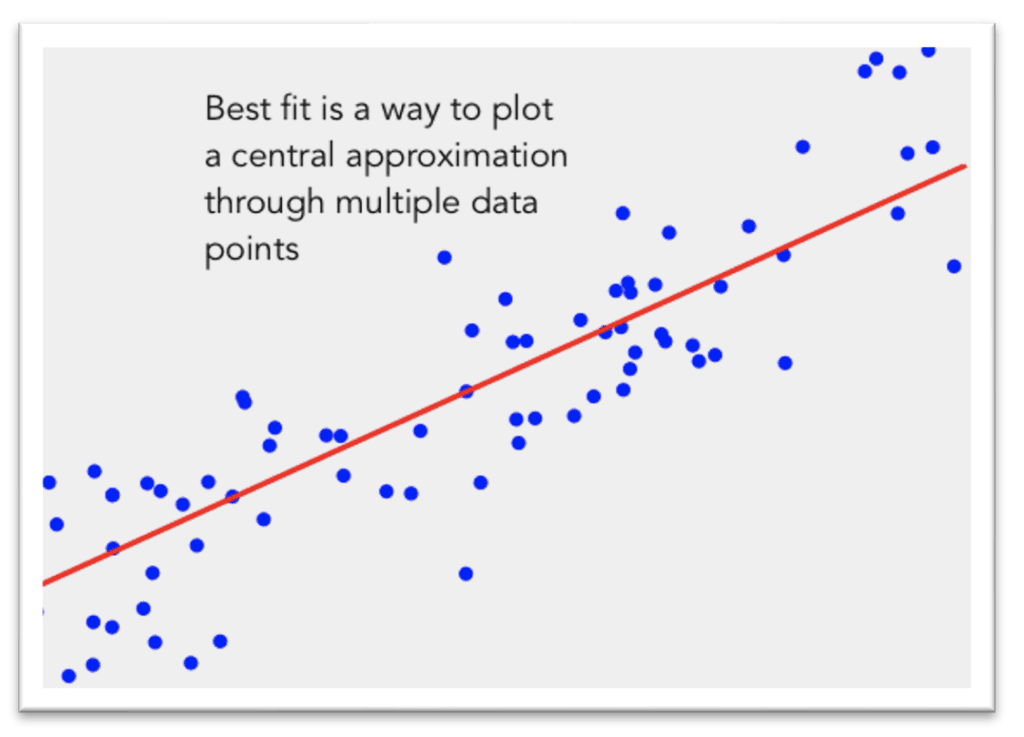
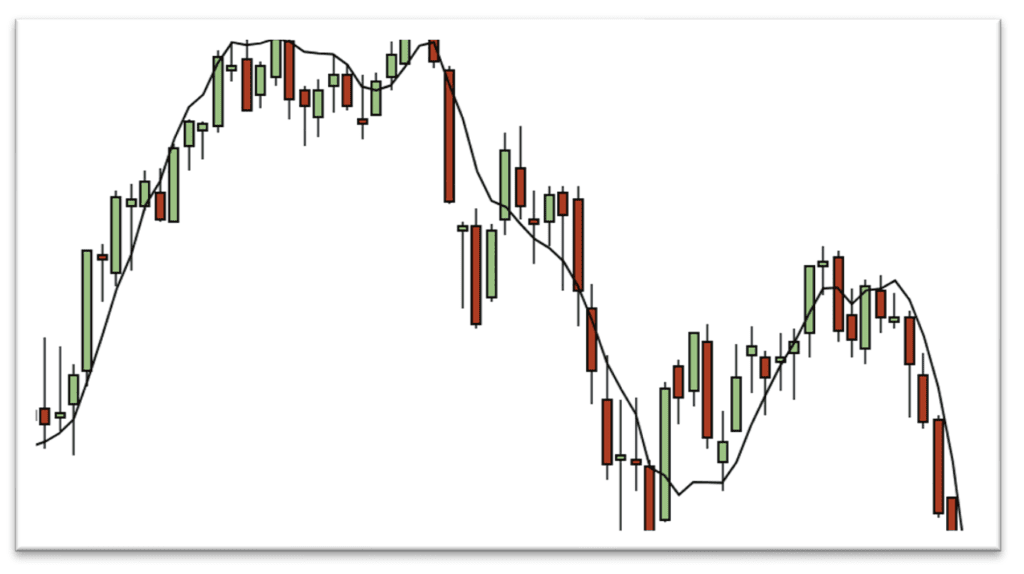
Linear regression looks a lot like a moving average line, but is calculated differently. Instead of being an average, it’s a ‘best fit’.
When added to a moving price chart, it looks a lot like a moving average …
It’s not the linear regression indicator itself that I want to look at, but instead two off-shoot indicators …
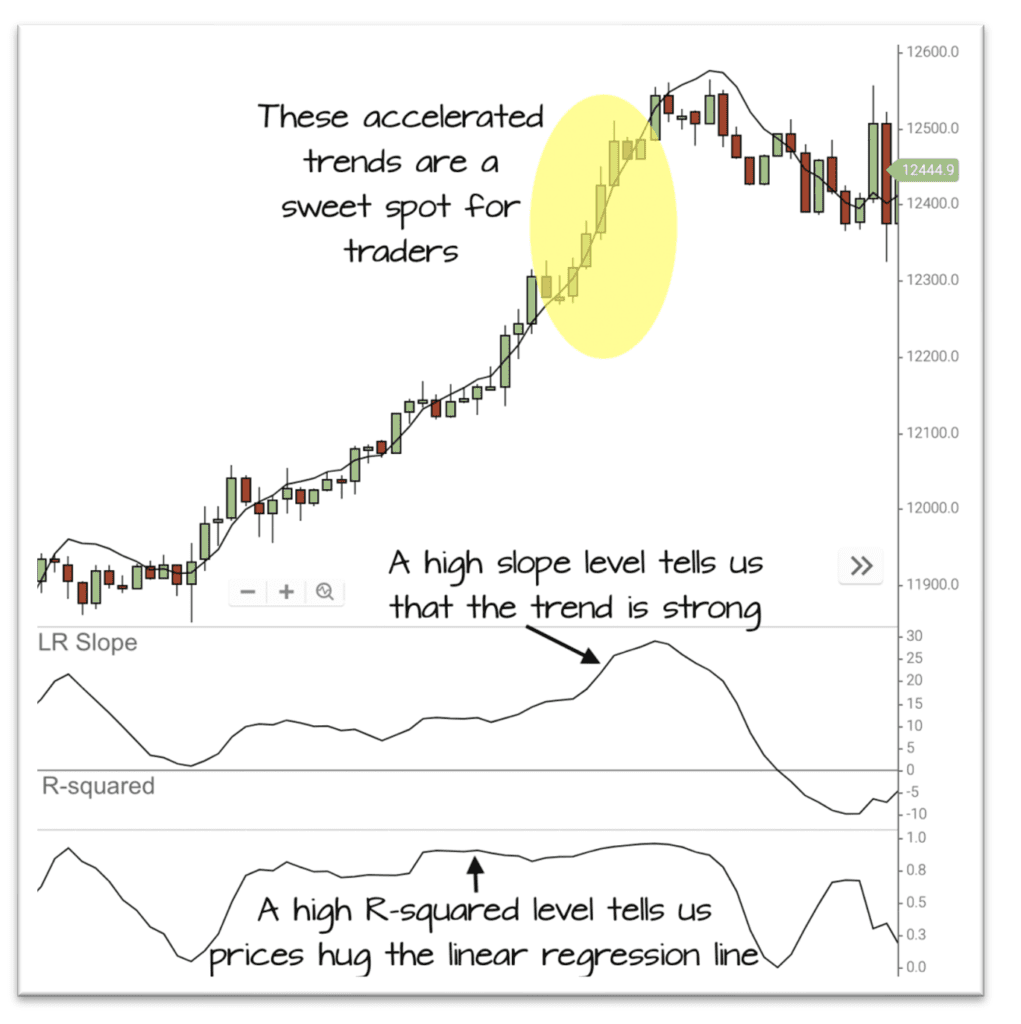
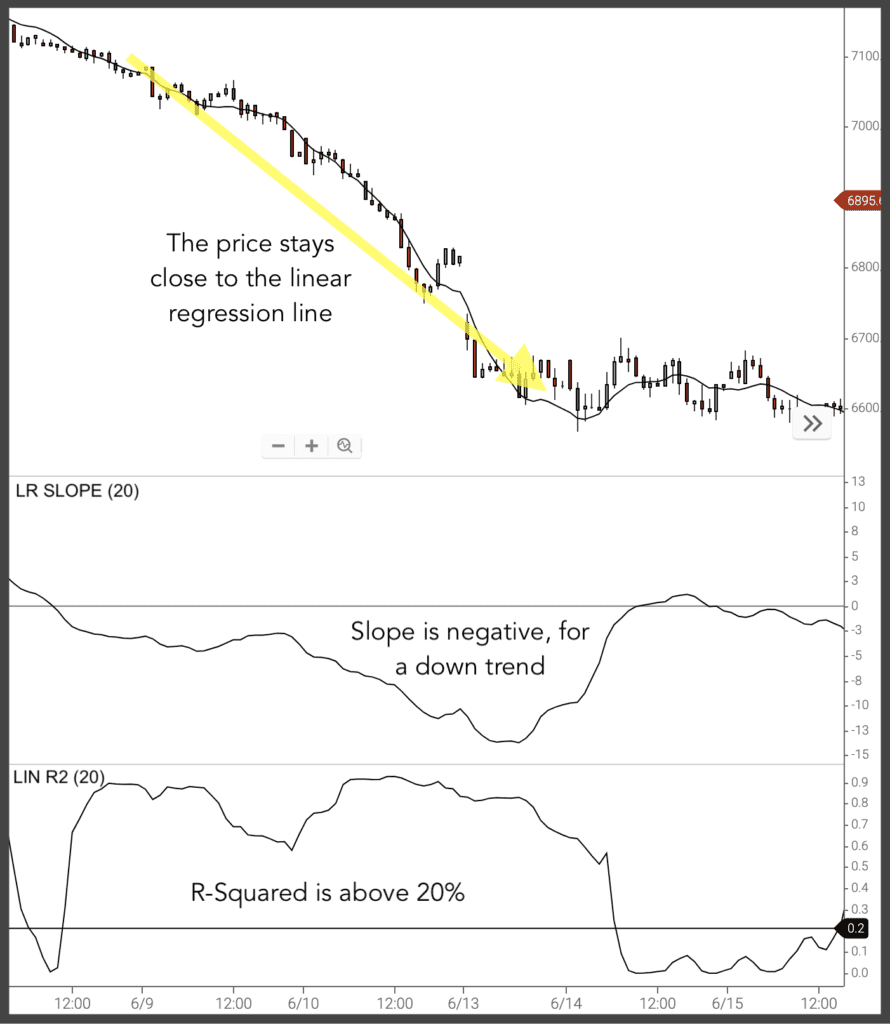
The linear regression slope – this measures the angle of the linear regression indicator (i.e. how fast prices are moving and in which direction)
And the R-Squared indicator – this measures how far the price has moved away from the linear regression point.
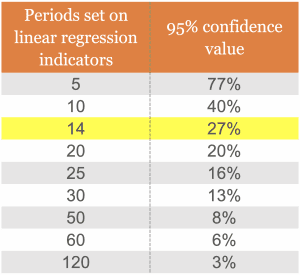
The default setting for R-squared is 14 periods, but whatever setting you choose, you can read off your certainty level on this chart …
This tells us that, to trade a trend with 95% confidence, you want your R-squared reading to be above 27% (or 0.27 out of 1.0).
On the chart below, my R-squared settings are 20 periods, so I’m looking for level over 0.2 (20%) to enter …
It’s important to remember that these are NOT entry or exit indicators – they are trend filters, telling us when it’s safe to look for buy trades, and when it’s safe to look for sell trades.
With that in mind, they can be added to any trend-following signals for extra accuracy.
I look forward to hearing how you get on with them …
You have to learn how to value the asset you are trading alongside the trend and then take trades on a pull back, perhaps to a previous SR or liquidity level, or a momentum trade entry, alongside appropriate orderflow i.e delta’s, limit order book, volume.










2 comments
Ray
OK, Mark, that’s whetted our appitite!
Now what about the trend signal, please, so we can put the two together………….
Peter
You have to learn how to value the asset you are trading alongside the trend and then take trades on a pull back, perhaps to a previous SR or liquidity level, or a momentum trade entry, alongside appropriate orderflow i.e delta’s, limit order book, volume.