February 22, 2013by Mark Rose- 2 comments
Perfect swing trade setups
I’ve talked a lot about trading timeframes recently.
And specifically how, while day trading is exciting and dynamic, we shouldn’t restrict ourselves to it.
Longer timeframes can offer the biggest profits and require less work on our part – it seems like a no-brainer!
But longer timeframes also require us to delay gratification – we often goes against our worse natures.
I long believed that traders naturally tend towards timeframes that best suit them. But these days I’m coming around to the idea that we may need a helping hand to nudge us in the right direction.
There’s so much talk and hype about day trading and scalping, and getting almost instant profits into our hands, that we often forget that there are alternatives – and very profitable, low-effort ones too.
Positioned neatly between day traders and long-term buy-and-hold investors, are the swing traders – these occupy this comfortable middle ground for investors who don’t want to be glued to their screens, but also want some of the cut, thrust and action of the markets.
Swing traders may hold positions for a few hours or a few weeks, but, as a general rule, their positions will play out over the course of a few days.
As a swing trader, you don’t need to worry about tick charts and minute-charts – instead, you can select a more generous timeframe, usually between one-hour and one-day.
Any charts less than hourly are cluttered up with “market noise” and short-term trends. Timeframes higher than a daily chart just won’t show up the opportunities you need – you could be waiting months for a pattern to emerge.
What is a swing?
The swing trader makes money from the simple fact that market prices don’t move in straight lines. The technique favours a trending market, although it can work a range-bound market, too. But the classic swing position is to trade the pullback in a trend …
It goes something like this:
Let’s say we have a strong upward trend on our price. Now, we’ve established that this upward trend isn’t going to be a straight line … there will be consolidations (a period of sideways movement) within that trend.
These areas are where the bulls and the bears are in conflict – the bulls have been forging the price upwards, but then bearish sentiment comes into play, causing some selling in the markets as people take profits.
It’s this interplay between the bulls and the bears that enables the swing trader to take his or her profit. The beauty is that the swing trader doesn’t need to take a bullish or bearish stance – just to watch the signals, and then cream off a profit while others tussle it out!
Finding opportunities
The swing trader uses daily and intraday charts to find these consolidations (or pullbacks) – i.e. where the price stops rising or pulls back for a period. This is where our swing trader gets in to capture the next move higher in the trend.
Here’s a 4-hour chart for AUD/USD – each time the price pulls back, it represents a buying opportunity for the swing trader:
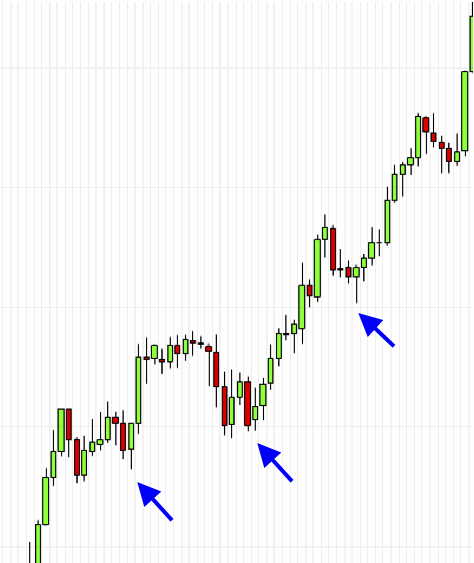
- Knowing how to trade pullbacks is key to the swing trader
So, what are the signals that the swing traders looks for to indicate these pullbacks?
Some charting favourites
Because of the relatively short timescale a swing trader uses, fundamental analysis has little impact on price movement, so buying or selling signals are usually made on technical analysis alone.
And a favourite bit of technical analysis for a swing trader is the flag or pennant chart pattern. They look something like this:

- Spotting flag and pennant patterns
Flags and pennants are short-term continuation patterns, and are among the most reliable of all continuation patterns.
In the pennant, the support and resistance lines move towards each other, and in a flag, they’re parallel.
But the important thing to remember with these kind of chart patterns is that the key is in the breakout – a flag or pennant alone is not the signal. If the breakout is in the direction of the trend, then the signal is that the trend will continue. If the breakout is against the trend, then it’s a signal that the trend is over.
Here’s an example of a bearish pennant on the Eur/CHF chart :
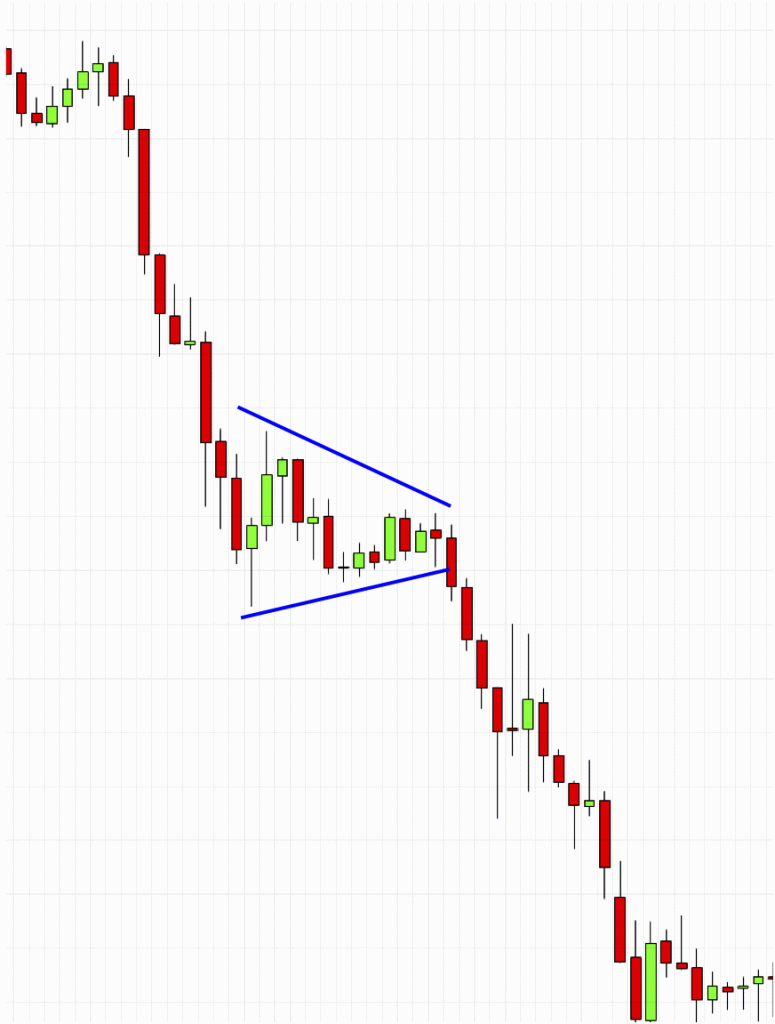
- Bearish pennant pattern
Once that candlesticks breaks the bottom of the pennant, it’s a strong signal that the downward trend is about the resume – and a great selling opportunity for the swing trader.
(One point to be wary of with a pennant is how close to the apex the breakout comes – as you near the point of the triangle, just a tiny swing can cause a breakout, so it gets easier and easier for the market to make false move here. Ideally, we want the breakout to occur about two-thirds of the way into the triangle shape. Any further than that and the probability of false signals increases.)
By following this technique, observing higher timeframe charts and only entering trades in the direction of a major trend, swing traders can work the odds in their favour.
Plus, they can free themselves from being tied down to 10 minute charts!
Much more coming on longer timeframes in the coming weeks …









2 comments
Laurie
Thanks for a fascinating post on flags and pennants Mark. I looked at these patterns years ago and didn’t take it any further but having read your post it seems that I should have done!
Liam Francis
Very good email. Keep it coming.
Regards,