The speed
at which global markets can tank has been put to the test this week, with major
indices plummeting by 30-35%. Gains that take years to accumulate, can be wiped
off in the space of a few hours.
For the
average person, the price level of the FTSE seems like it has little importance
to day-to-day life. And, even those of us who watch it carefully, would have to
admit that the price of the FTSE has more to do with levels of fear and greed
in the markets than an accurate calculation of ‘value’ – whatever that is.
But anyone
with a pension fund will have seen it impacted this week. And anyone with
savings will know that it’s harder than ever to get a return on that money with
interest rates back down to their record lows.
However,
there are steps we can take to help protect ourselves in the midst of these
financial impacts.
The first step is to be proactive
Markets do
not move in straight lines, and there are always opportunities to make medium-term
profits within larger market trends. Consider looking at trading opportunities
that would hedge longer term investments you have.
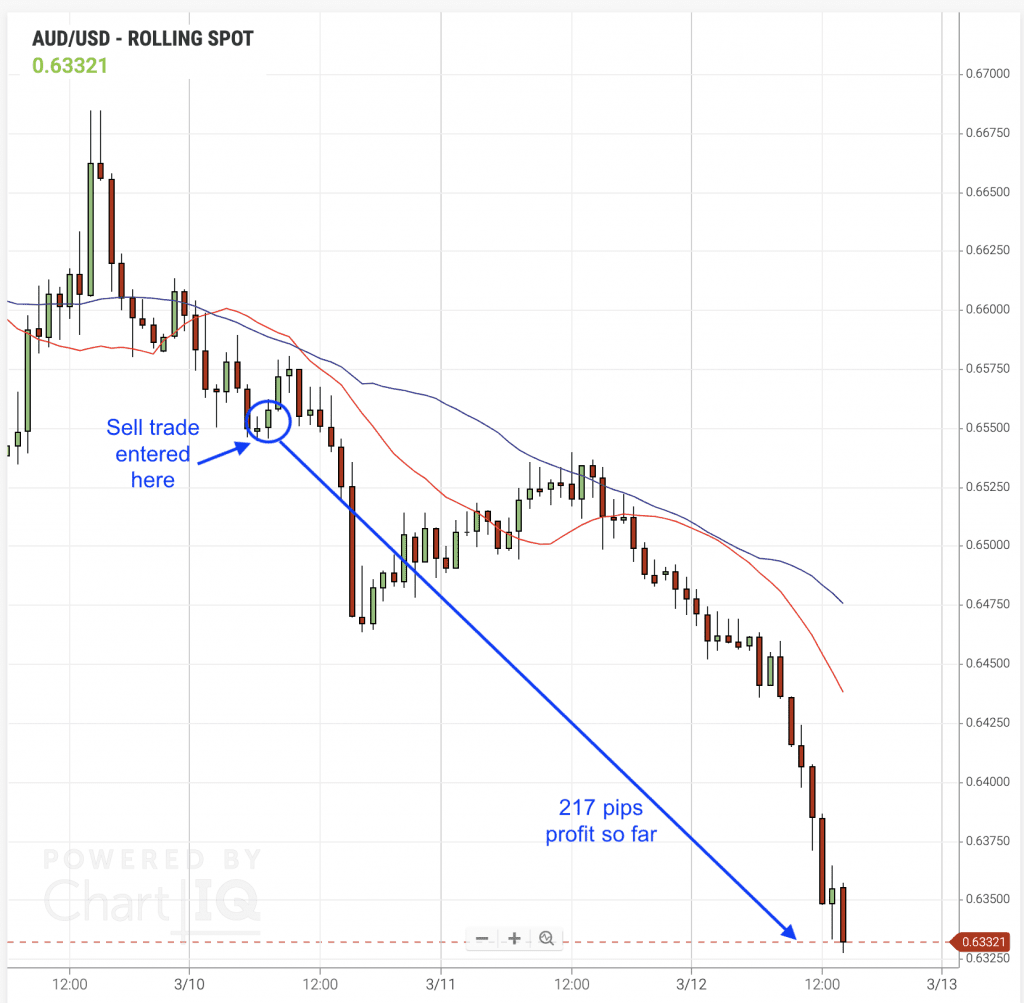
Here are a couple of recent moves caught with my Heikin Ashi Mountain strategy on the Forex market …
These are
purely technical trades, signaled by indicators rather than any kind of news or
fundamental analysis. This means that we’re following trends, rather than
trying to predict them.
The first, here, rides off the back of weakness in the Australian dollar …
While the second example picks up profits as money moves into the Japanese Yen safe-haven currency.
One of the big advantages of Heikin Ashi Mountain is that it slots into a swing-trading middle ground, taking profits from medium-sized moves over a few days. This means that we’re more adaptable than longer term strategies, able to catch moves and counter moves. Plus, our stop distances tend to be pretty generous, and have a smart feature that adapts them to recent volatility levels.
Which
brings me onto my second important point …
Beware volatility
Traders
with tighter stops, or stops that are fixed and don’t adapt to changing circumstances
are much more likely to see themselves bumped out of trades when market
volatility spikes.
And then
there’s slippage – which happens when markets are moving too quickly so your
broker is unable to fill your order at the level you’ve requested. In the past
week I’ve had some positive slippage – this is where you end up getting out of
a trade at a better price than you’d expected. But positive slippage is pretty
rare – some brokers are better at giving it where its due than others.
The more
normal kind of slippage is the negative kind, where our trade gets closed after
the stop level has been reached, or a new trade is triggered at a worse price than
we’d hoped to enter.
There’s
very little we can do about slippage – fortunately it doesn’t happen too
often. The best defence is to sit out of markets at the most volatile times.
Here I’m
going to look at two volatility measures … one specific, that’ll help with stop
placement; and one that gives a wider snapshot of market behaviour.
The first is the average true range
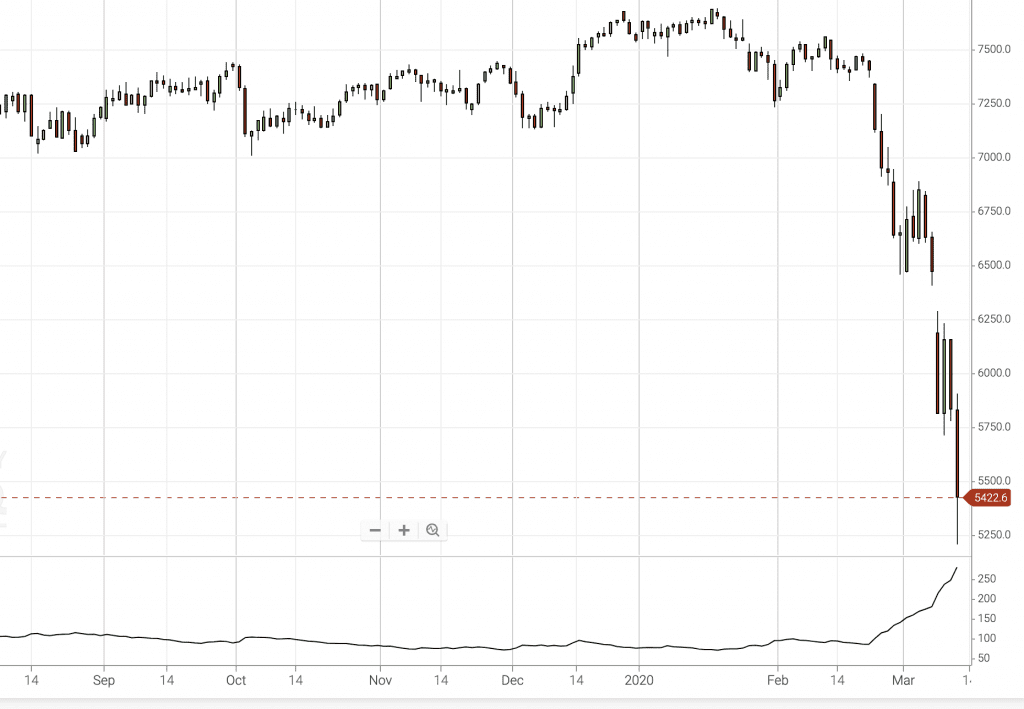
Here’s the average true range indicator in a daily FTSE chart …
It shows
how the average daily move on the instrument has leapt up this month, from
around 100 points to 280.
This is
extraordinary volatility, and should be a warning to traders who don’t have very
deep pockets. While I’ve said that we should be proactive in seeking out opportunities,
sometimes ‘active’ investing involves knowing the right moments to sit on our
hands. For those with smaller funds, huge stop ranges required to trade this
kind of volatility may not be realistic.
But there
are plenty of other markets, which haven’t spiked with this kind of violence,
and these can offer us much safer opportunities.
And what about the return to normal?
Unfortunately,
there is no ‘normal’ on the horizon for the markets just yet. But the best
forecaster is to look at the VIX index.
The VIX – often
called the ‘fear index’, and less often called the CBOE Market Volatility Index
– is seen as a measure of market sentiment. It’s made up of prices for options
on the S&P – the gist is that traders buy put options as insurance when
they’re worried about market conditions.
So, if
traders are worried, the VIX index goes up. If traders are complacent, the VIX
goes down.
Generally,
we like to see the VIX index hovering around the mid-teens. If it spikes above
20, it indicates market jitters.
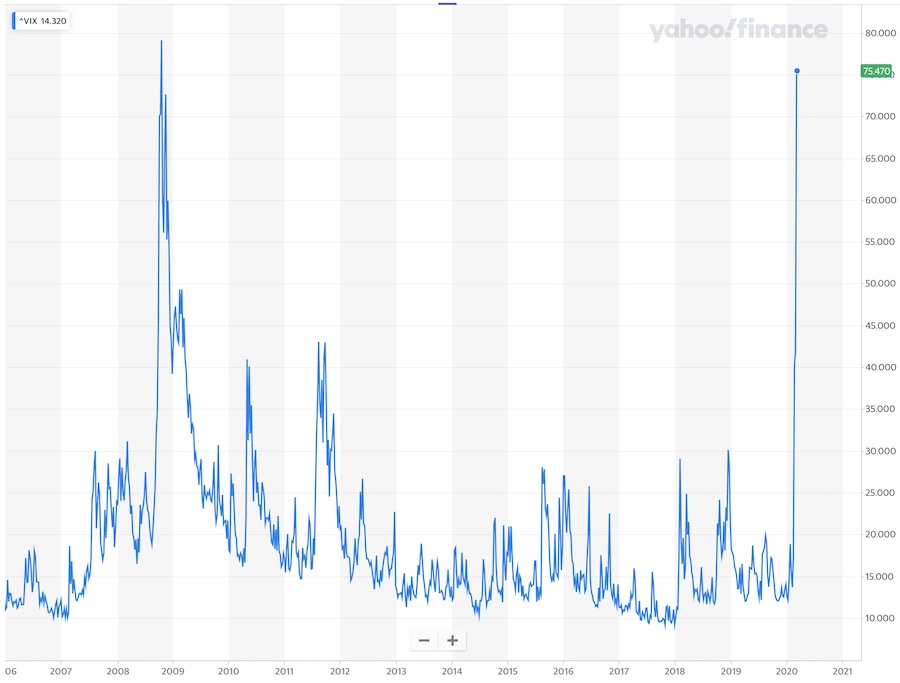
Let’s look at where the VIX is now …
Yes, at 75,
that’s way out of the comfort zone – a level not seen since the financial crash
of 2008.
The VIX
claims to have predictive powers, so when this figure heads back down towards
20, we start to anticipate a return to ‘normality’ – whatever that is.
In the meantime, watch your stop levels, be prepared for slippage, accept that sometimes the best action is to sit out … and please wash your hands …