June 12, 2015by Mark Rose- 13 comments
Directional movement indicator – the Swiss Army Knife of signals
I’m about to show you some signals on the EURGBP pair for last month.
I think you’re going to be impressed by them.
One of the big problems with any trend-following strategy is knowing when the trend just isn’t strong enough to trade. Most trend traders get stung with big losses when the market loses direction, or whipsaws around.
But this signal tells us when to sit out, and has been getting us out of duff trades fast … while letting the big moves run.
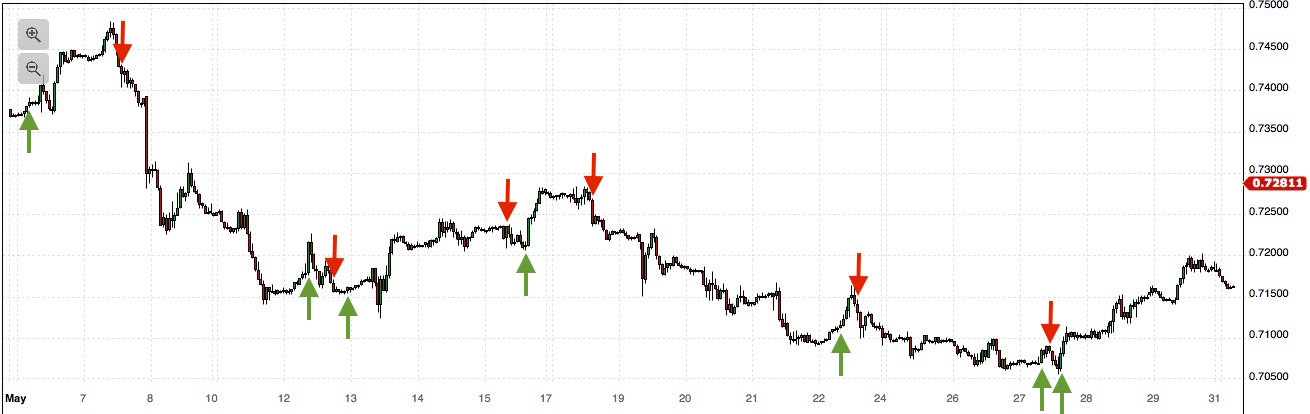
Take a look at these trades on EURGBP for May (the green arrows show buy signals; the red arrows show sell signals).
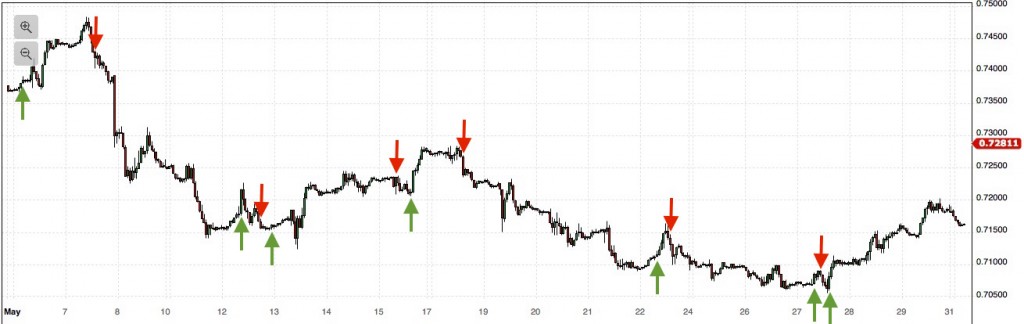
What you’ll notice is that it gets us in nice a promptly on trend moves, but quickly gets us out when there’s a change of direction.
Looks interesting?
I’ll show you how to bring it up on your chart, and we’ll look at bit more in depth about how to enter the trades, and what would be sensible entry and exit criteria for them …
The indicator I’m talking about is the Directional Movement System.
Once you’re in, bring up a chart, and select “Directional Movement System” from the indicators menu …

Some platforms will show this as three lines, but I like the ‘cloud’ look that this broker uses – it’s very intuitive … if the cloud turns green, we have a buy signal; if it turns red, we have a sell signal.
Can’t really get much simpler than that! (Although there is a little more to this indicator, which I’ll get to in a moment.)
And now for the close-up
Here’s the details on one of those sell trades …

Rule 1:
The yellow ADX line tells us about the strength of the trend. If it’s above 25, we have a strong trend; if it’s below 20, we have no trend. My rule is that we won’t be in the market if the yellow line is below 20.
Rule 2:
The green and red ‘clouds’ indicate where the positive and negative DIs are above or below each other. We’re interested in the crossovers, so if the cloud turns green, we have a buy signal; if it turns red, we have a sell signal.
Rule 3:
We want to be sure that our buy and sell signals aren’t caused by a sudden spike that’ll quickly reverse, so we wont’ enter our trades immediately. Instead, we’ll draw a level at the candlestick where we got our signal (that would be at the bottom of the candle for a sell trade, and at the top for a buy trade) – if this level is breached, we’ll enter the trade.
And that’s it.
Trade parameters
The examples shown in this post are on hourly charts, so we want to give them some space to come good.
Criteria for coming out of the trade would be:
– The ADX falling below 20
– A reverse signal
As you can see, some of the moves to be enjoyed on this have been substantial, so you could use a wide trailing stop, or a method of taking partial profits (you can find lots of ideas for smart ways to exit trades in this post)
I look forward to hearing your thoughts and any other ideas you have for trading with the Directional Movement System.
(Check out more of the best trend indicators here)










13 comments
Mark Rose
As you can see in the first chart, there are some big moves to be had if we catch a strong trend with this signal, so it would be a good idea to use a dynamic stop loss that follows the price, so you can lock in profits. A parabolic SAR would be one option. However, you ask about the initial stop – just beyond a recent high or low would be my advice. When you get the signal, the price is likely to have just turned, so don’t make it too close – the ADX line falling below 20 should do a good job of getting you out of a trade that’s going nowhere, so your stop loss will be there in case of sudden swings. I hope that helps.
Mark
Hi Mark, could you please give some details about how to set the initial stop lose?
Thanks
Darin
Hi Mark, I’ve been looking for a simple reliable method of trading longer term moves and i think this might be it! I’m going to use it on daily charts combined with some basic price action. A quick check of half a dozen pairs showed roughly 400 pips could have been gained since the beginning of June so should be very interesting.
Mark Rose
Sounds fantastic – let me know how you get on.
Michael
Looks a nice simple way to get into and out of trades. I presume that you put on the arrows and that they are not placed there by the software. Do they offer a MT4 platform or, if not, can one alter the colour scheme? I find the yellow line almost invisible.
Mark Rose
Hi Michael, yes, the arrows were added by me. Just at the top of your chart it should say “directional movement system (14)” – click there and it’ll let you adjust the colour scheme.
Mo
That’s brilliant Mark. Did a quick simulation of my 70+ trades I did last month – I could have improved my performance to around 65%. It’s now permanently affixed to all my charts. Many, many thanks
Mo
Mark Rose
Wow – that’s impressive. Really pleased that other traders are as pleased with this indicator as I am! Happy trading!
John
Sorry Mark forgot to ask if it works as well on Indices.
Mark Rose
Hi John, To be honest I’m really just starting out testing this addition to my trading, so I don’t have any clear answers for you. But can’t see any reason it couldn’t be applied to indices. I’ve been working with the hourly timeframe, but it’s proving quite tricky to manage technical exits without any automation, so am hoping to look at a range of timeframes. Would be great to hear feedback from other traders using this tool.
John
Hi Mark. Interesting indicator. I will give it a try. You have illustrated this indicator on an hourly chart. Is this the best timeframe or does it work equally well on all timeframes.
Terry
This looks really exciting Mark – thanks for the heads-up as ever. Am off to have a play with this indicator-will let you know how I get on …
Mark Rose
Look forward to hearing how it goes