August 24, 2018by Mark Rose- 0 comments
How to use the supertrend indicator

Last week I was banging on about how we all need to be aware of the trading range of any product we’re following, so this week I thought I’d show you a dead simple all-in-one indicator that’s based on the average true range.
I’m deeply suspicious of any indicator that does everything for you – I guess I feel that it just sounds too simple … and I worry that if it were that easy, everyone would be trading it and the markets would adapt to negate it.
But there’s something very appealing about this tool – it’s so ridiculously easy and intuitive, it really feels like cheating.
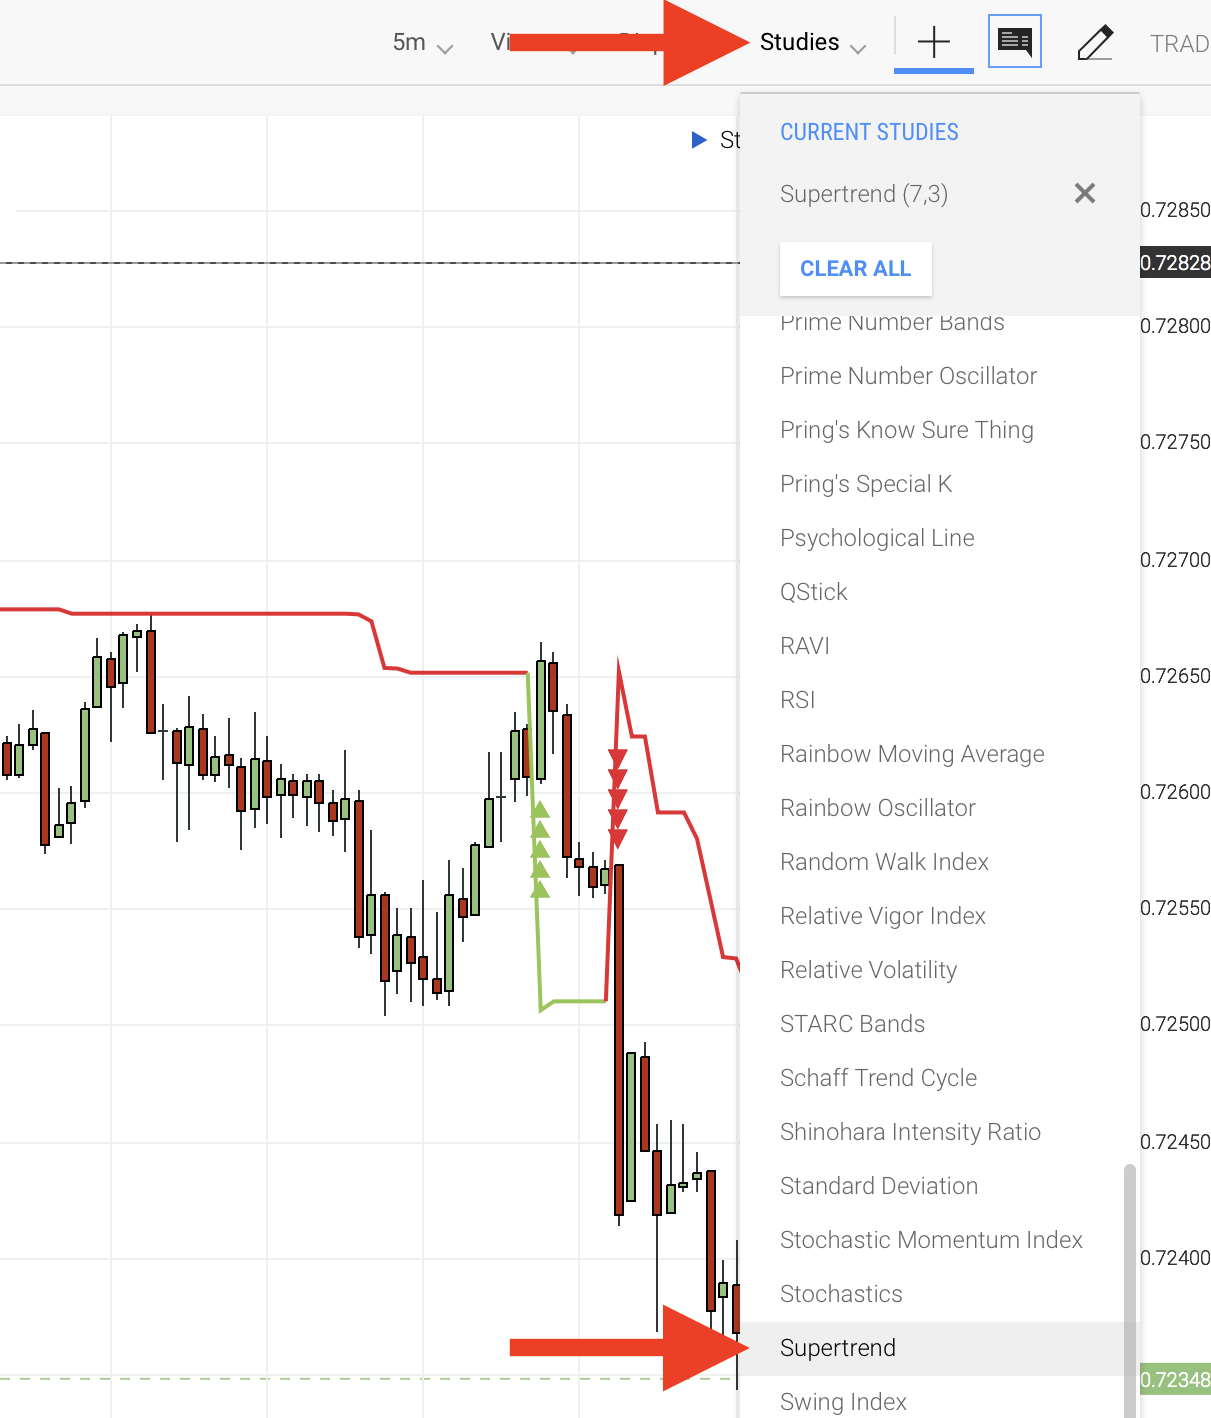
If you’re not familiar with the SuperTrend indicator, you may be able to find them in the list of available indicators on your broker’s platform (depending on which broker you trade with).

With my broker, they are in the listing of indicators under the ‘Studies’ drop-down menu.
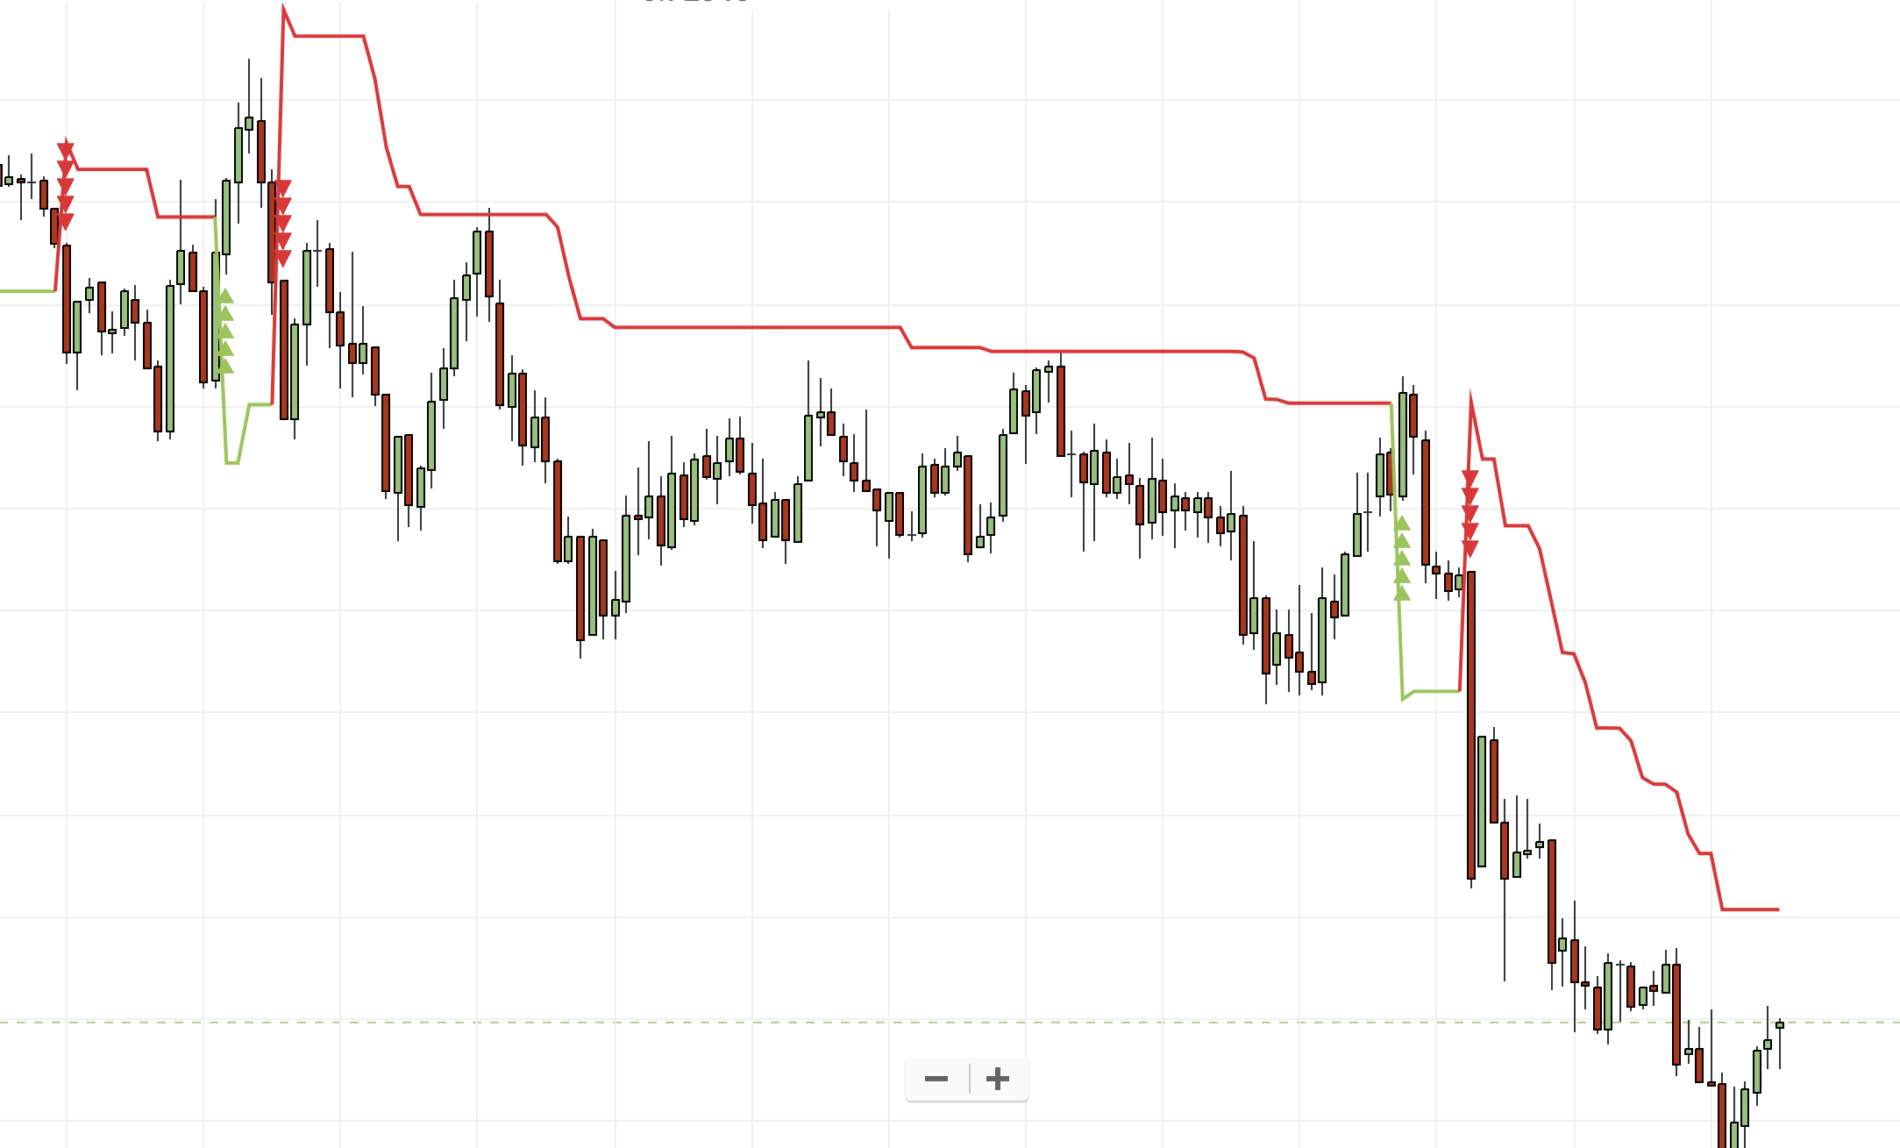
So, when you open up a chart and apply the Supertrend indicator, you’ll see that it consists of a line that flips from one side of the candlesticks to the other. If it’s above the candles, it’s a sell signal; if it’s below the candles, it’s a buy signal.
The lines also act as convenient trailing stop levels, allowing you to reduce risk and ultimately start to lock in profits as your trade progresses …

The red arrows and green arrows signal where you should be getting into a sell or buy trade, respectively.
It’s a bit like a PSAR indicator, which you may be familiar with, but a lot less skittish.
The image above is a very good example of the kind of signals it gives – you can see two losing trades, followed by a very modest gain … before the big move happens and we get a sell trade with a good profit on it.
This is typical of trend trading, where we’ll often have a high number of small losses while we wait for the big winner.
Psychologically, this kind of trading can be tough.
Here are some more examples …

This shows a 5minute chart on the German DAX.
If you’re using the line as a trailing stop, it’ll involve following the trade closely.
Bear in mind that the profit/loss figures shown here don’t include spread costs, and they assume you’re getting into and out of the trade right on the nose as the 5-minute candle opens. So, the reality of trading this way will be tougher.
But there are certainly some profits to be taken here if you use this smartly
My advice would be to stick to short timeframes. I’ve been looking at 1-min to 15-min charts.
Because of the way the supertrend indicator works, if you’re not getting a sell signal, you’re getting a buy one – there’s no middle ground for when there’s just no trend at all. This makes it very vulnerable to sideways markets.
In shorter timeframes, when the markets are always making some modest moves, this isn’t such an issue, but if you want to apply it to longer timeframes, I’d recommend a ‘sit on your hands’ filter. This could keep you safely out of the markets when trends aren’t strong enough.
I’d be interested to hear about any successes or frustrations you’ve had with the supertrend indicator.
To enjoy more content and get it faster