January 28, 2011by Mark Rose- 0 comments
Expert advisors vs robots: who to trust?

I need to start off this week with an apology.
I promised last week to bring you details of a new forex strategy that I’ve been using, and I’m afraid that I haven’t yet managed to get pen to paper on it.
That doesn’t mean that I haven’t been using it! It has taken a little time to set up – but I’d say that this is time very well spent. As I write, it’s just “pinged” at me to alert me to another trade!
So, apologies if it looks like I’ve been keeping this one to myself. I really will bring you a full report on it next week.
Fancy yourself as a computer programmer?
The system that I’ve just been talking about is set up on Metatrader, and I thought that this week I’d talk a little about the Metatrader software ….
Many traders believe that Metatrader is the best thing since sliced bread! Others are put off by the belief that to use Metatrader you need to be highly technical and to speak fluent “MQL-4” (the language Metatrader is written in).
Whilst you can get significantly more out of Metatrader by speaking the lingo – there are plenty of ways to take advantage of other people’s know-how.
No doubt the folks who wrote Metatrader are computer whizzes, but fortunately, us humble folks who use it don’t have to be!
What is Metatrader?
Metatrader (or MT4 as its current incarnation is called) is a ready-built all-inclusive online trading platform, and – best of all – it’s completely free.
Most FX brokers now provide MT4 free to their customers, in order for them to access all the built-in technical indicators and expert advisors, whilst getting live prices from the broker.
Many traders will loosely interchange the words “expert advisor” and “robot”. If you’re a regular reader of Trader’s Bulletin, you’ll know that I’m not a fan of robots, but it’s important to explain that an expert advisor is not necessarily a robot. A robot has access to your trading account, whereas an expert advisor can be set up to give you trading signals, which you then decide whether to act on.
Personally, I feel that this is a much better and safer way to trade. And next week, I’ll introduce you to an EA that has been achieving great results – and is a very good way in for someone finding their feet in Metatrader.
Candlestick of the week
This week we’re taking a look at one of the best-known reversal indicators:
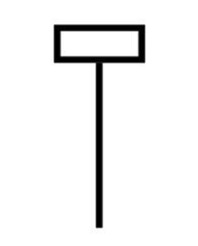
It is a candlestick pattern that consists of just one candle, with a long lower wick, short body, and little or no upper wick. Strictly speaking, the lower wick should be at least two times longer than the body – the longer, the better. And depending on where you find it on a chart, it is called either a hammer or a hanging man.
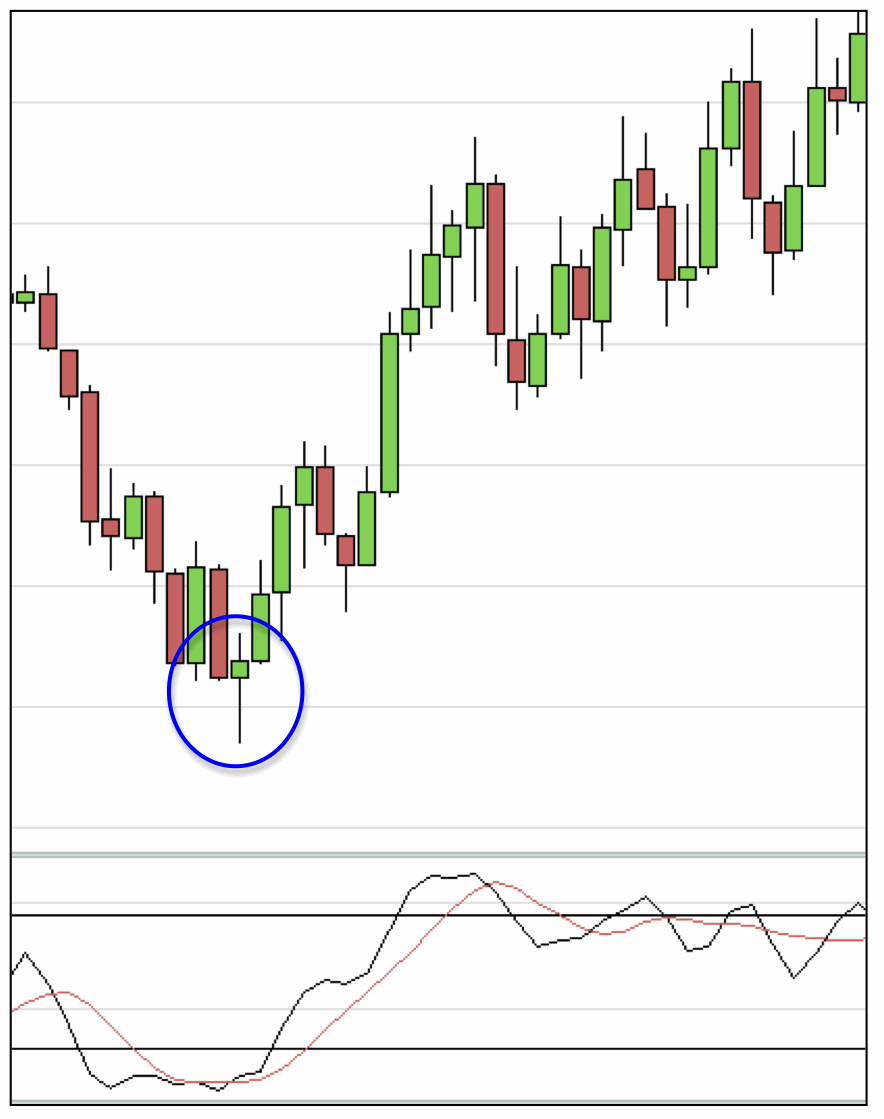
A hammer: is found in a downtrend, and signals a bullish reversal. The long lower wick shows a period in which sellers where in control, but the body shows buyers coming back in. From this we can tell that there is strong buying by bulls as the period of sell-off declines.
As with all single candlestick patterns, we should wait for next candle to confirm that buyers are in control.
Here’s a chart for Eur/USD earlier this week. Note how the strong selling action and increased volume (indicated by the long lower wick) on the candlestick is reversed as buyers come back in, and that this coincides with an oversold indicator on Stochastics. The green candlestick opening above the body of the hammer confirms the bullish trend.
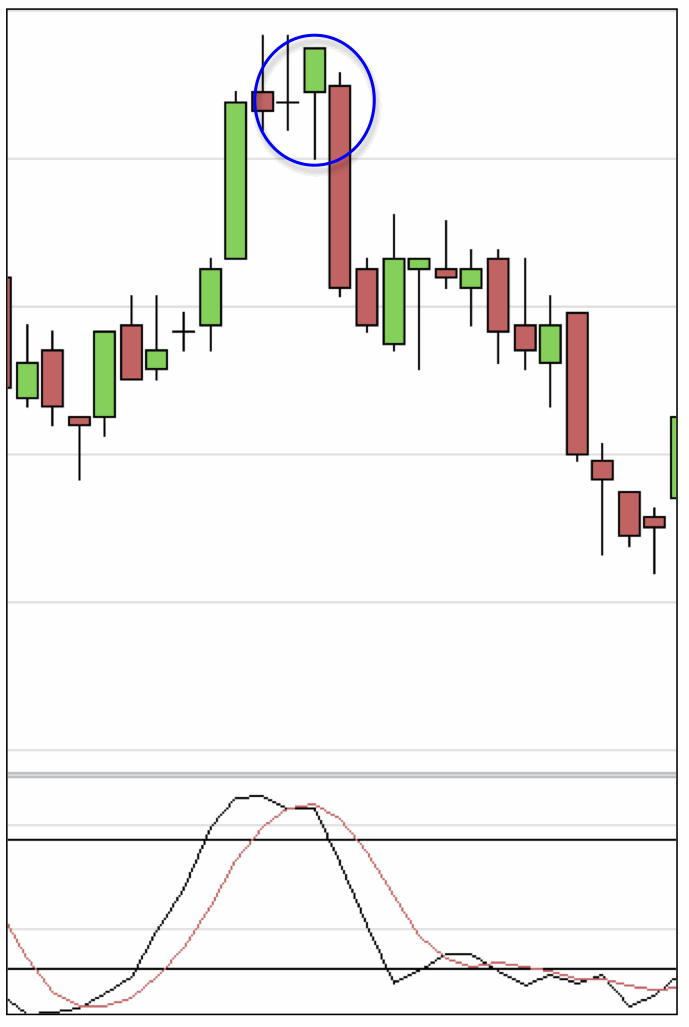
A hanging man: is the same shape as hammer, but found in an uptrend. We don’t expect to see strong selling pressure (seen in the long lower wick on the candle) in an uptrend, so here it suggests a change of market sentiment and a reversal to downside.
Here’s an example from the FTSE 1-minute chart on Wednesday this week:
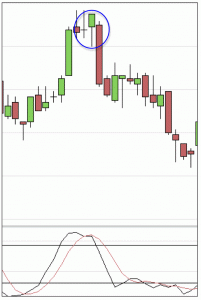
In this case, the hanging man shape coincides with the Stochastics showing the price to be overbought, and the next candle confirms the move.
If you’re not familiar with the Stochastics indicator, it’s not unlike the momentum indicator we discussed a few weeks back, in that it can be used to gauge overbought and oversold market conditions. I’ll add it to the list of things to be discussed in detail over the coming weeks.
There’s no hard and fast rule about what colour a hammer or a hanging man should be – the fact that they have a short body already means that there’s indecision coming into the market. However, a green (or white) hammer and a red (or black hanging man) are stronger indicators.
(The chart above is quite a good illustration, because you’ll probably be able to spot a couple of hammers on there, too – see what you can find!)
Until next time,
Mark Rose