Fibonacci Retracements and Extensions: everything you need to know
The architect Antoni Gaudi claimed that there are no straight lines in nature. Whether or not this is true will depend on your definition of ‘straight’ vs ‘looks straight’, but it’s definitely the case that markets never move in straight lines.
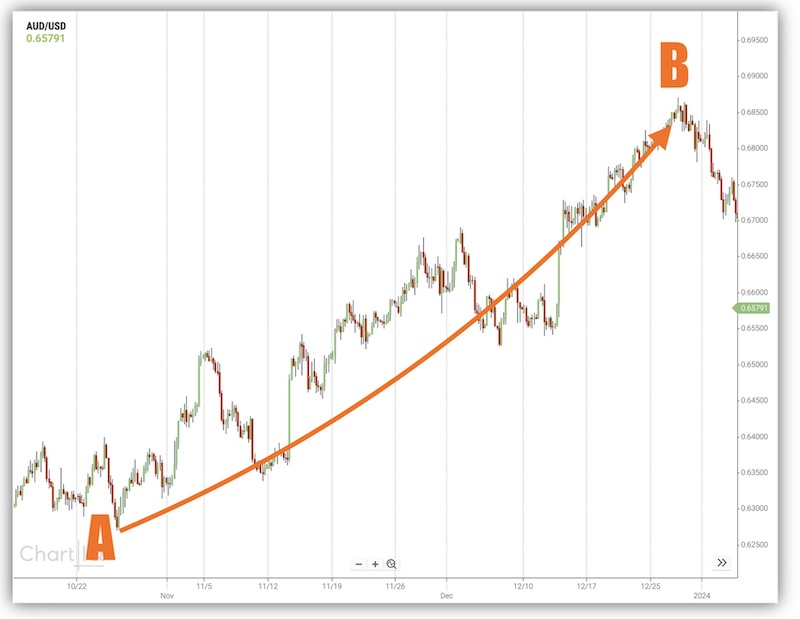
As traders, we want to make money by jumping in while the price is moving from A to B, and riding that journey.
But, all those ups and downs along the way will shake out the weaker and less-experienced traders. I expect it’s something we’ve all had experience of – getting stopped out of trends, only for the price to resume its longer-term direction.
For stronger traders, those ups and downs aren’t a headache – in fact, they are our opportunities to enter trends or add to positions as corrections revert back to the main trend direction.
All you need to make this happen, is the right tools …
The tool, of course, is the Fibonacci retracement and extensions grid.
Introduction to Fibonacci Retracements and Extensions
I won’t go into a maths/history lesson here about Leonardo Fibonacci and his rabbits (you can find out more about counting rabbits here) … I want to get straight into the nitty gritty about what the levels are, and how to use them in your everyday trading …
The standard Fib ratios are 23.6%, 38.2%, 61.8%, 78.6%, plus the Gann ratio of 50%.
These percentages can be used for both retracements and extensions.
I’ll look at retracements first …
How to Read Fibonacci Retracements
A Fib retracement is a system to measure how far we can expect a market to pull back before resuming a trend. To set this up, we need three things:
a trend to have established already
that trend to currently be in retracement
a pinpoint on the recent swing high and swing low
Here we have a market trending upwards and we’ve located a recent high/low to measure our Fib levels between.
To actually draw them onto your chart, most packages will have a tool to do this for you. Here’s how to do it on the Trade Nation platform …
How Do You Know Which Swing High/Low Are The Right Ones?
Finding the right high/low can put a lot of novice traders off using Fib levels in case they get this wrong. I’d urge you not to let the perfect be your enemy here. Start drawing – you’ll be amazed how quickly you get a feel for it.
Think about the timeframe you’re trading in. If you’re trading 4 hourly charts and holding positions for days or weeks … then looking at a high/low from today isn’t going to be a lot of help. Think about the move you’re looking for and find a high/low that’ll be a suitable measure for it.
Taking another look at the same chart as above, if I’d chosen a more recent low, I’d still be getting useful information from the Fib levels …
How Do You Know Which Fib Level Price Will Turn on?
As with any key level on your charts … you don’t!
Fibonacci levels can’t give you hard-and-fast rules – these are key areas where things happen, be that sharp bounces, messy consolidation, or nothing at all. It’s up to us as traders to watch at these levels and make judgement calls.
Look for Fib levels that combine with previous support/resistance levels or pivot points – this doubling-up will give extra credence to turning points.
How to Trade Fibonacci Extensions
Fibonacci levels don’t end when the trend resumes – they can also be used to measure how far the next leg of that trend could run. This is really useful in setting realistic profit targets.
To set these up, we need three levels:
The recent swing low
The recent swing high
The retracement turning point
A move of 100% is a standard measure – matching up with the initial swing high-low distance. But the Fib extension levels give extra opportunities to take partial profits along the way, or to jump out early if there’s other significant obstacles.
Of course, in a strong trend, you can push those profit limits out further, to 127.2% and beyond …
Again, your trading platform will be able to draw this on for you.
You may have noticed that the default Fib levels on Trade Nation don’t include all the ratios I’ve mentioned here. You can add them in by right-clicking on the drawing and going to the settings (cog) tool, as shown below.
But beware of cluttering up your charts with too many Fib lines!
My Top Rules for Using Fibonacci Retracements and Extensions
Fibonacci only works in trending markets
A Fib level isn’t a signal in itself – look for other key levels or price action around these price points
Don’t expect neat bounces – like all key levels, Fibonacci levels can be magnets for consolidation
Fibonacci retracements and extensions work best on longer timeframes and aren’t ideal for day trading
Let me know how you use Fibonacci in your trading. And test your knowledge on the Fib Quiz HERE.