Imagine if you could add a few lines to your price charts, which will clearly – and reliably – show you where trades should be entered or closed, where stops should be set, and profits taken?
That would make your life a lot simpler, wouldn’t it?
The lines I’m talking about are support and resistance levels. And here I want to show you a foolproof 3-step way to mark them onto your chart, and 5 simple tricks to use them for profits.
What are Support and Resistance lines, and why should I use them?
Resistance is an area where the price of an instrument has reached a ‘top’ – the price has gone up to this level, and traders have sold, viewing it as ‘too expensive’. Conversely, support is an area where a price has hit a ‘bottom’ – here, buyers have come in, viewing it as a bargain.
The result is that on a price chart, we see prices bouncing down from resistance levels, and up off support levels …
By knowing where these key levels are, you have an incredible insight into where the price of a market will hit its ‘crunch points’. And if you don’t know this – you’re at a huge disadvantage, because these are the moments where we should be looking for signals, whether they are in the form of price action, or simple buy and sell triggers.
But aren’t support and resistance lines subjective?
A lot of novice trades don’t like to draw support and resistance levels, because they worry that they may draw them wrong. In fact, you’ll find internet forums devoted to the correct way to join up the dots on a price chart, and berating novices for their ‘wrong’ levels.
This is the kind of approach that makes me fume. Yes, you’ll get better, and quicker, at drawing support and resistance levels with practice, and yes, there is an element of subjectivity about them. It’s unlikely that your S&R levels will be exactly the same as the next traders, but a poorly drawn level is a million times better than no level!
So, please, get drawing …
Here I’ll run through the text-book method to draw support and resistance lines, and then I’ll tear those up, so you can get drawing genuinely useful lines for yourself.
The rules to draw support and resistance levels
Here’s what the text books tell us about how to draw support and resistance lines …
The market needs to get rejected at least twice for it to count as support/resistance.
The more often your level is tested, the more valid it becomes.
The more recently a level has been tested, the stronger its support or resistance.
If support is broken, that level becomes resistance. Likewise, is resistance is broken, that level becomes support.
Now I’m going to tell you to ignore the first three of those four rules …
And here’s a simple 3-step guide to adding USEFUL lines to any price chart.
Step A)
Switch to a longer timeframe than the timeframe you’re trading. So, if you’re trading 15-minute charts, look at 4 hourly. If you’re trading daily charts, switch to weekly.
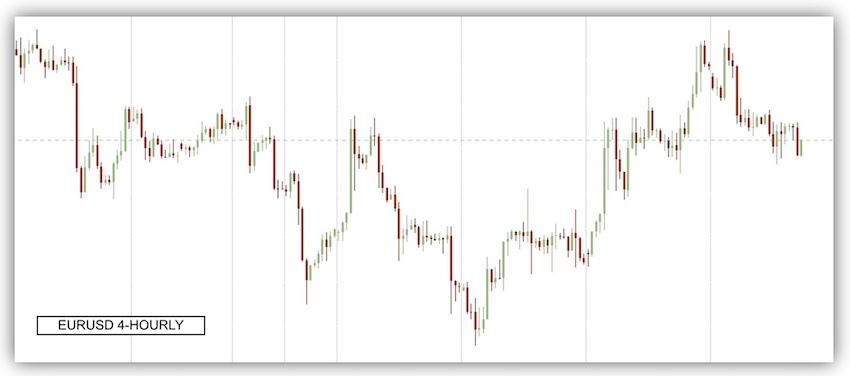
Here’s a recent 4-hourly chart for EURUSD …
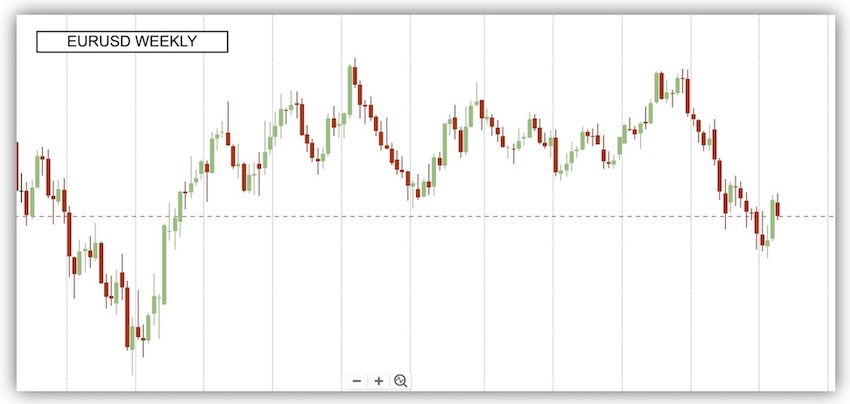
If I switch up to a weekly chart, I can see current price behaviour in more context, and that price has recently broken out of a range it’s been moving sideways in for two years …
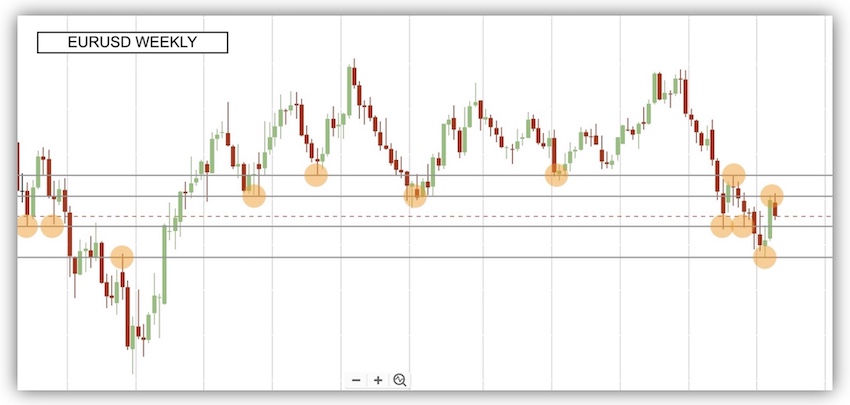
I’m going to draw support and resistance levels, but only lines that are near to the current price action, so which could be relevant to my trading right now …
Step B)
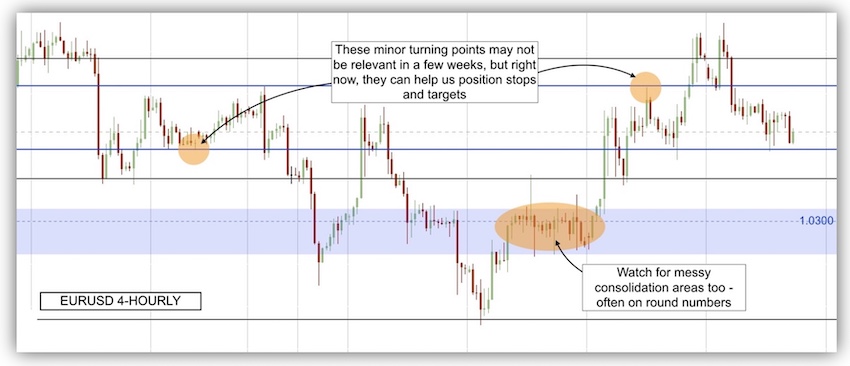
Now switch back to the timeframe you’re trading to look for levels that could be useful.
If your stop is 50 pips away, then you don’t need to be worrying about support levels that are 200 pips away. So don’t clutter up your chart with unnecessarily information.
Step C)
With these lines drawn on your chart, you can now get on with your normal trading, but with these factors in mind:
Always look out for signals around these key levels (these are the places where market moves happen)
Avoid buying as prices approach resistance.
Avoid selling as prices approach support
Don’t place targets just beyond S&R levels, making them harder to hit.
Don’t place stops just within S&R levels (nor too close to them), as this makes them easy pray for stop-loss hunters.
Be aware of the magnetic ‘pull’ S&R levels have on price.
There are some really powerful techniques to apply at these levels – ensuring you’re using them to maximize your profits, and minimize any risks you’re taking in the market.
Top tips and dangerous traps to note when you draw support and resistance lines
One-hit wonders
The ‘wisdom’ that a level should be hit multiple times to count as support or resistance is probably the most dangerous myth surrounding these lines. Some of the most powerful support or resistance levels will get the most fleeting touch by prices, before rebounding. And watch particularly for levels that the price bounces off very quickly – this shows the strongest action by traders, jumping in to push the price in the opposite direction.
Do support and resistance lines join wicks or bodies?
This is a question often asked by traders who are learning to draw these lines, and there are plenty of people out there who’ll argue one case or the other. The truth is that it can be either.
Consider what’s often going on at a key level … stops are being hit, orders are being filled – there are likely to be thousands of orders pinging away, as the price bounces untidily about. This is why we often see what’s called ‘consolidation’ around this point – which just means an outright mess!
Wicks can often be momentary spikes through a key level, quickly corrected, so it’s not unreasonable to ignore them when drawing our lines. However, it’s worth remembering that the price did actually make this spike, and hit that level – so, if you’re placing a stop, beware that gap between the body and wick.
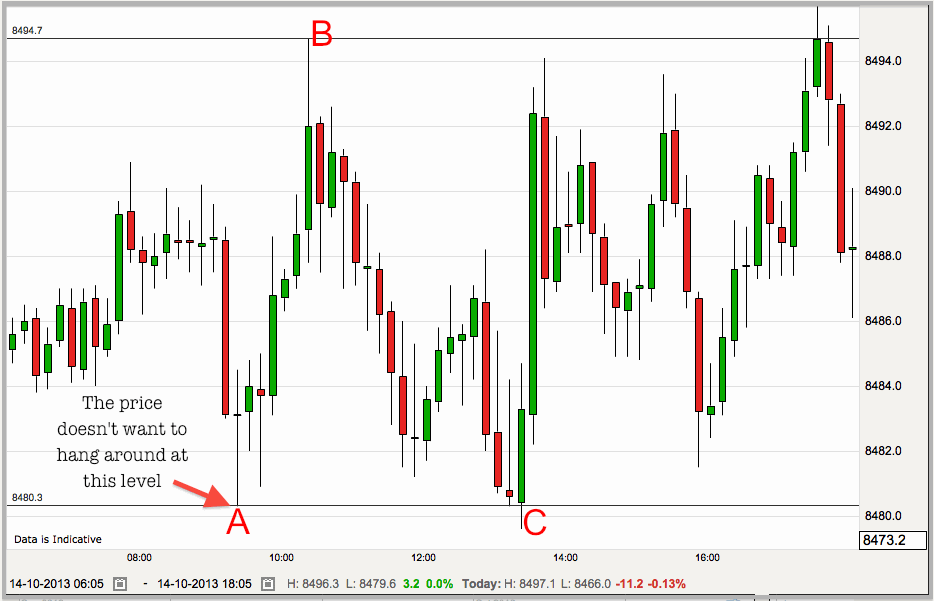
Take a look at this chart, where the wicks at A and B represent areas that the price has touched and powered away from – and we see the affect that hitting these prices again has on future prices.
Because S&R levels are inherently messy …
… it’s best to think of them as price ‘areas’ rather than fixed points. So, if one trader is telling you that the key level is 0.8494, and your line is drawn in at 0.8484 … neither is wrong, because both can be in the support ‘area’.
Really struggling to see the support and resistance levels?
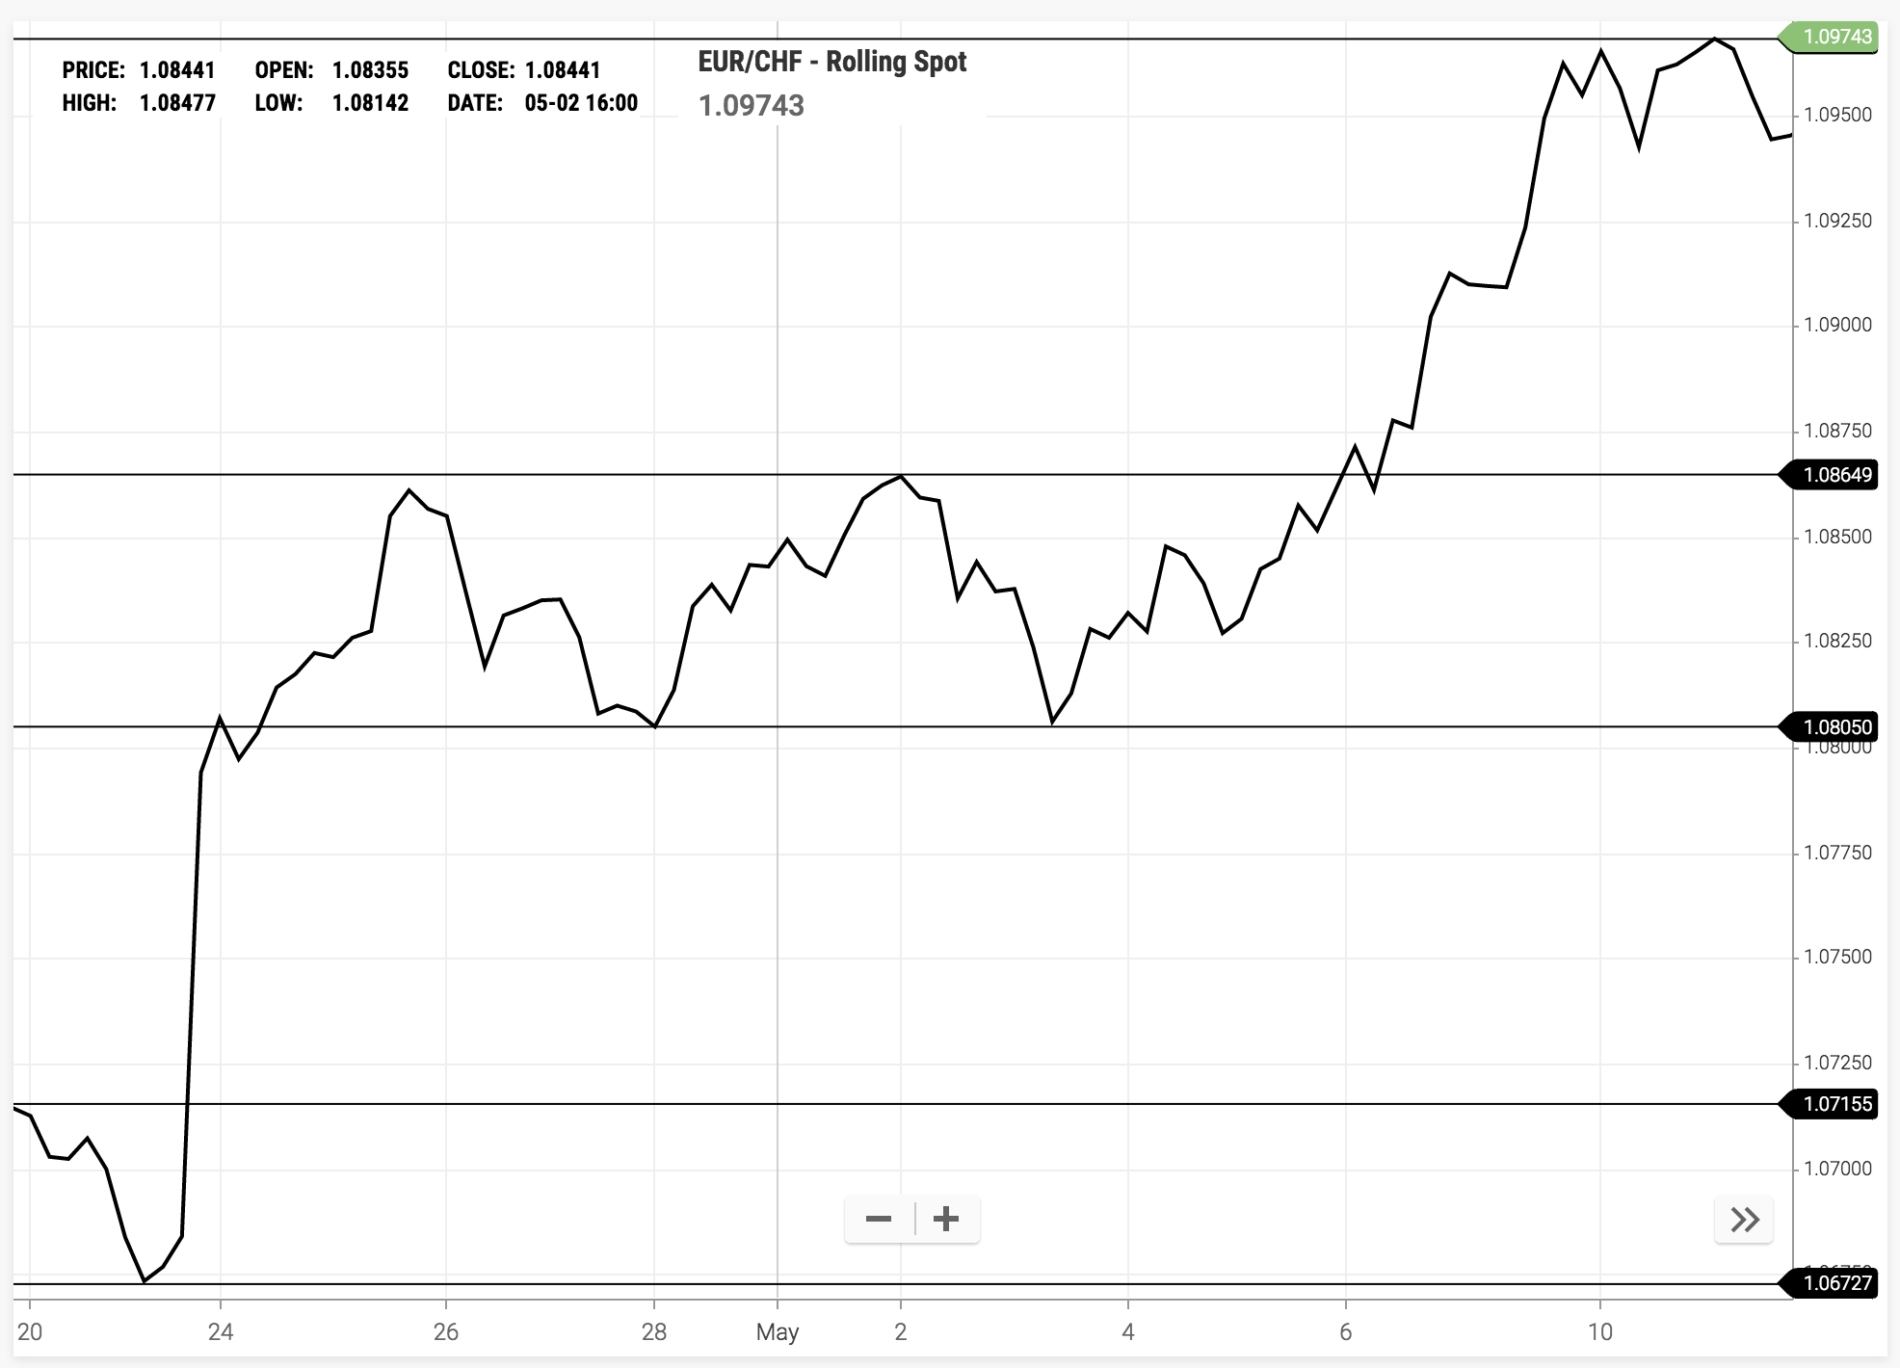
A quick trick is to switch from candlestick to line charts. By removing the ‘clutter’ of the candle bodies and wicks, it’s much simpler to see the price turning points.
Of course, these levels won’t be identical to those you’d draw on a candlestick chart, but they’ll be plenty close enough to guide you.
Two levels very close to each other – which should I pick?
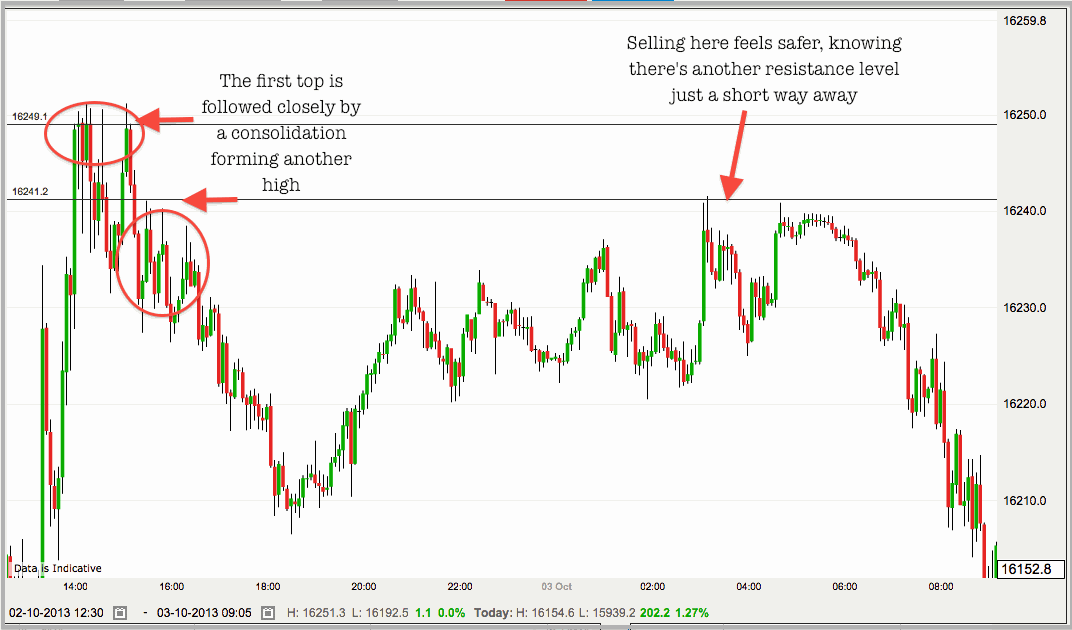
In this scenario, many traders may worry about which is the right one to pick, but in truth, two nearby support/resistance levels can give us access to a great trade set-up, where we stack key levels, one behind the other …
This trade technique really thinks about where buyers or sellers are in the market – and uses them to give us the security of a nice tight stop, and a confident trade entry …
And one of the best things to watch for at these key levels are price-action triggers – these are the little patterns in the candlesticks that warn us whether they S&R level is going to be bounced off, or broken. For more information on reading candles, check out the Trader’s Bulletin guide HERE.
Mark, you are a very good teacher with good sense of humor too. Apart from learning, I enjoy reading the introductions which are laced with laughter.
well done.
Personally, I don’t use these in any of my trading, but that’s not to say there isn’t a relevance in these levels. With my Heikin Ashi Mountain system, I’m strongly reliant on the highs and lows set by these daily candles (which will be slightly at odds with the levels given by a conventional candle). Also, Pivot points are worth taking a look at as key levels based on the previous day’s highs & lows.












4 comments
RAY
Mark, you are a very good teacher with good sense of humor too. Apart from learning, I enjoy reading the introductions which are laced with laughter.
well done.
Mark Rose
Hi Ray, Thanks for your kind words. Glad to hear you’re enjoying the updates. Let me know if there’s a topic you’d like me to dig into.
M Alexander
Do you use s&r levels calculated from previous days H & l etc?
Mark Rose
Personally, I don’t use these in any of my trading, but that’s not to say there isn’t a relevance in these levels. With my Heikin Ashi Mountain system, I’m strongly reliant on the highs and lows set by these daily candles (which will be slightly at odds with the levels given by a conventional candle). Also, Pivot points are worth taking a look at as key levels based on the previous day’s highs & lows.