I get a bit
frustrated with the whole ‘New Year, New You’ industry. It’s usually trying to tell
you that you’re horribly lacking and that your life will be perfect if you just
buy this …
But that’s
not to say that there’s no room for improvement, and that we shouldn’t be
striving for better ways to do things and new achievements.
This
January, the pile of books by my bed includes ‘Indistractable’ by Nir Eyal,
which is a kind of antivenom to his previous book, ‘Hooked’ – it promises to
train me to focus on the important stuff, rather than be distracted by the
pings coming from my phone and computer.
There’s no
shortage of distractions in the markets to send our trading off balance. It’s called
‘market noise’ for a reason, so I figured I’d kick off the new year with a list
of the noise I want to hear, and the noise I want to filter out …
Noise or signal?
• Pundits and opinions
Newspaper
headlines, data reports, market pundits, and general know-it-alls … all these can
create a great deal of market noise. We should be aware of market-moving
events, as they have the power to bump us out of trades. However, unless you have
bribed someone to get a 3 second head start on data releases from a central
bank … if you’re trading these, you’re just chasing the noise rather than
reacting to it.
Following
price action on charts will give you the most accurate picture of market
sentiment, so I’d advise anyone to be very wary of listening to opinion or
fundamentals in major markets and forex.
• Spikes
Spikes are
those long wicks on candles that stick out into ‘thin air’ on our charts –
forging into territory that we aren’t anticipating price action.
I don’t
suggest that these should be ignored – the extremes of spikes can be some of
the most powerful support and resistance levels out there. But I do advise that
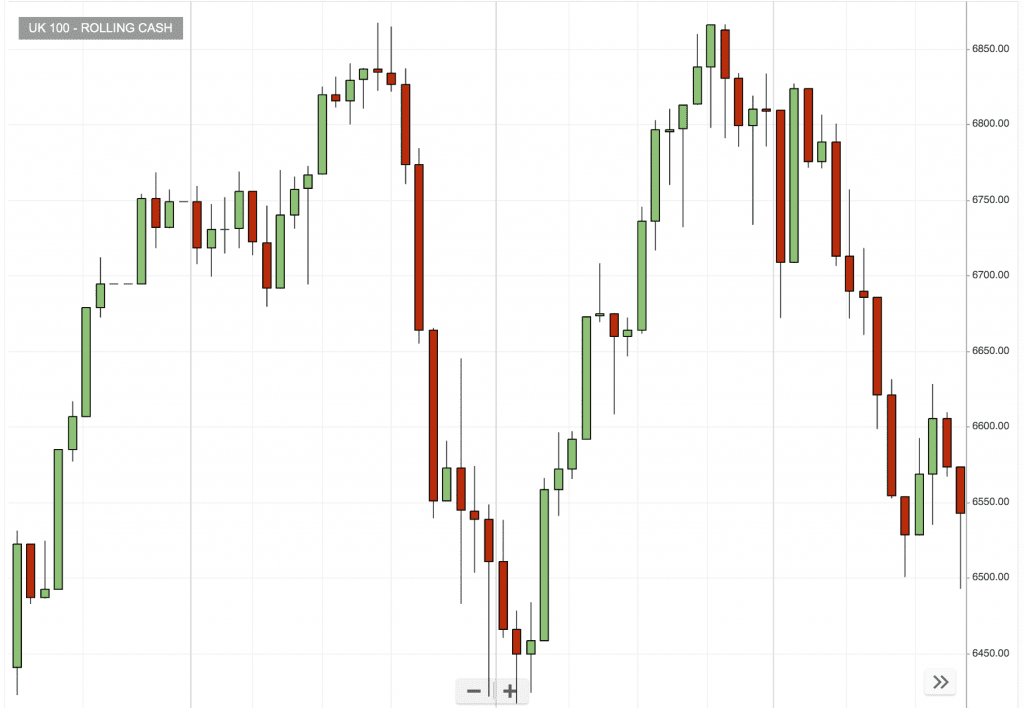
they are treated with caution – this is not normal everyday price action.
The chart below shows how a spike hasn’t affected the price behaviour in the channel that followed it. But it did offer a powerful resistance level that the price later reacted with.
• Smoothing curves
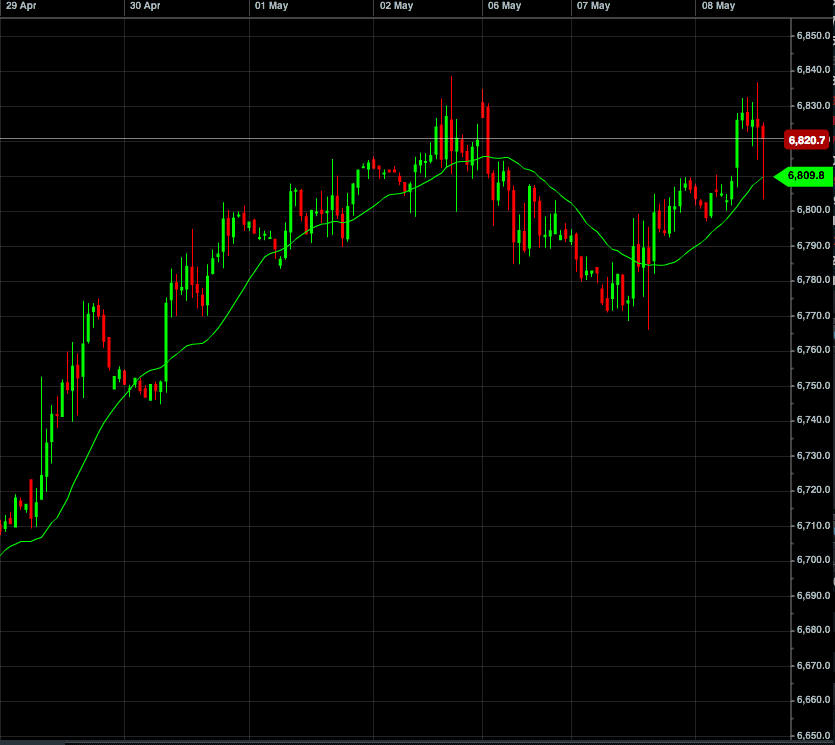
The most basic noise filter for your charts is a moving average. Here, a 20-period moving average smoothes out the bumps in our chart, giving a clear picture of the overall trends …
However, moving averages are based on
the previous x-number of periods (the more periods you use, the smoother they
are) – which means, by definition, they are lagging. They just tell us about
what has happened – not what’s happening now.
While that can be valuable
information, it’s not what gets us in on our trades nice and early.
• Removing time
At the other end of the spectrum are Renko charts, which ignore
time altogether and look only at ‘blocks’ of price movement.
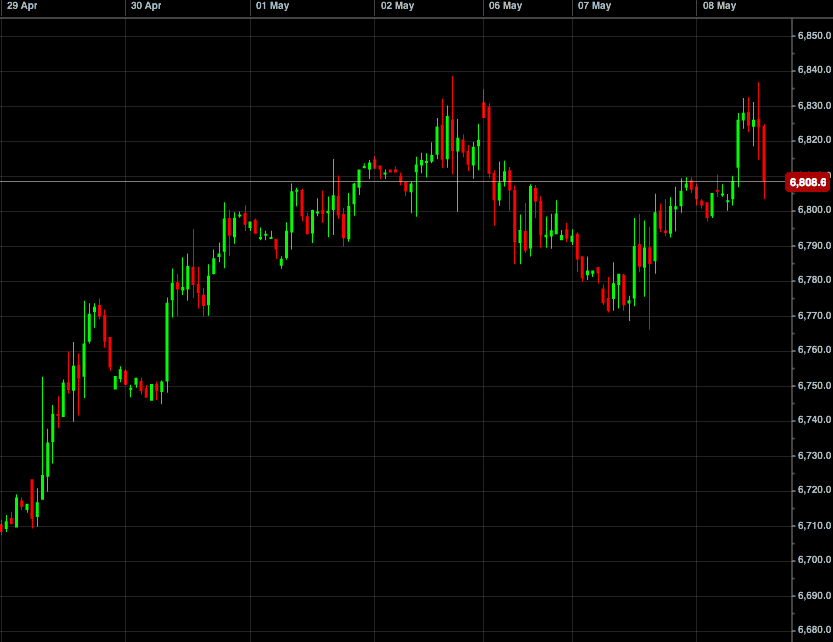
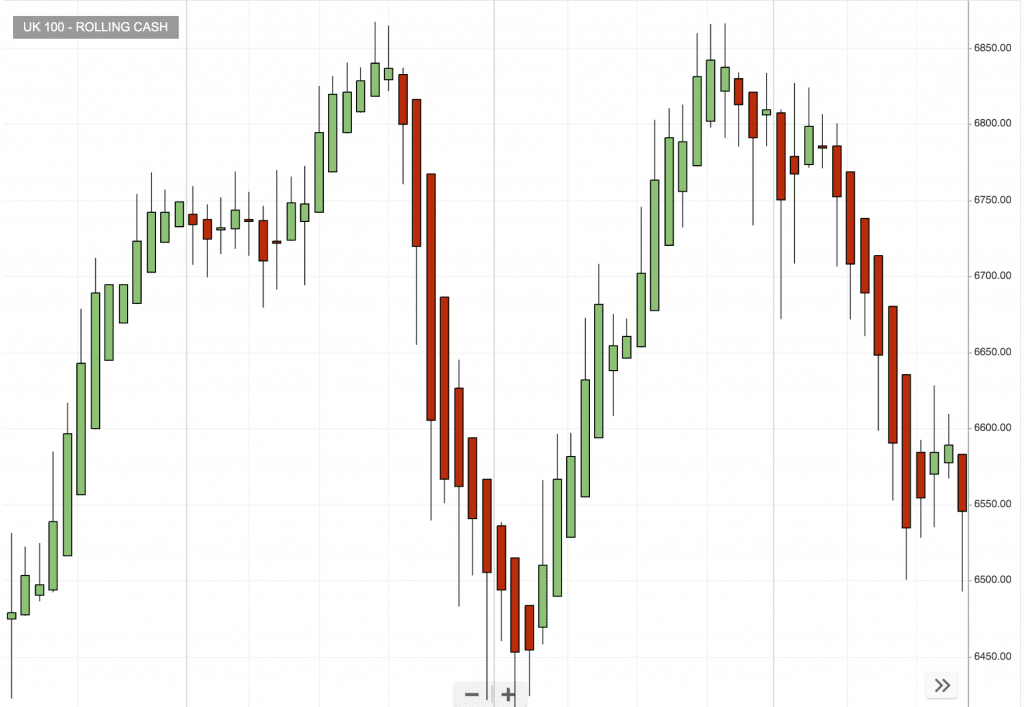
Here’s an example of a normal price chart, with lots of noise, spikes and false moves …
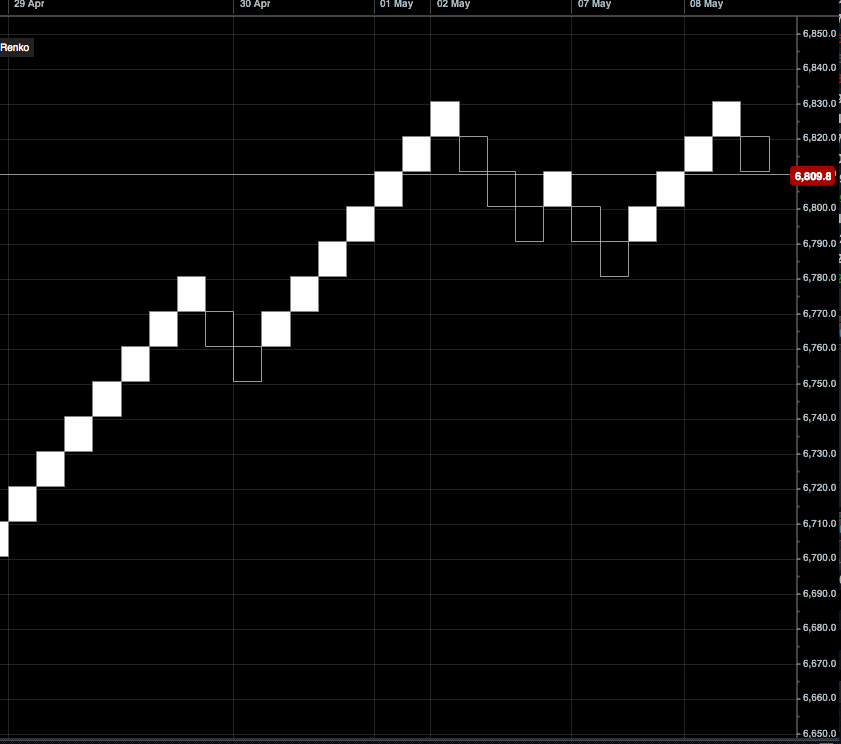
And here’s the same time period shown in a Renko chart …
The ‘noise’ has been filtered out, and we can clearly see the
trends. Notice that time only moves on when price changes – if price stays the
same, it doesn’t move.
• Average bars
Heikin Ashi Mountain traders will already be familiar with the powerful effect of these ‘average bar’ candlesticks, which can turn this …
Into this ….
Working out
what’s worth listening to, and what’s just background noise has a lot to do
with understanding the timeframe you’re trading in. What’s just noise to a
long-term investor, can be vitally important to a day or swing trader. When you’re
looking at price behaviour, consider how long your trade will run for – will
this information still be relevant in an hour, day, week’s time?
We can all
be guilty of holding onto positions out of sentimentality for the ‘great’
signal we saw, that is now long-forgotten by the market. A lot of successful
trading is about admitting when we got things wrong, cutting losses, and moving
onto the next signal …










2 comments
Julian
Great article Mark, thank you.
Mark Rose
Thanks for the feedback Julian – pleased you enjoyed it. Here’s wishing you a very prosperous 2020!