February 19, 2016by Mark Rose- 2 comments
How to use the chandelier exit
Lots of questions over the past week about exits; many coming from traders who are sitting on Elder Impulse profits, and wondering just when to take them.
Last week I wrote about using the ATR (the average true range) as a guide for where to place a stop or a target, and I’ve promised to go into more detail on this, with exact details of exit strategies that you can apply.
And I’ve chosen to kick off with the brilliantly named “chandelier exit” – so called by Chuck LeBeau because “just as a chandelier hangs down from the ceiling of a room, the chandelier exit hangs down from the high point or the ceiling of our trade.” However, I prefer the image of our hapless trader hanging from a chandelier, humming a Sia song, choosing the moment to leap off that will cause minimum damage (let’s not dwell on what that says about my trading style).
Instead, we’ll take a look at the thinking behind the chandelier exit …
It’s based around the previous 22 periods. The wisdom being that there are about 22 trading days in a month, so if you’re trading a daily chart, it will be looking at a month’s worth of data.
So, the ATR setting it’s based on is 22 periods. (The default on your chart settings is probably 14, so you’ll need to make this adjustment). This will give you the average daily range over the past month.
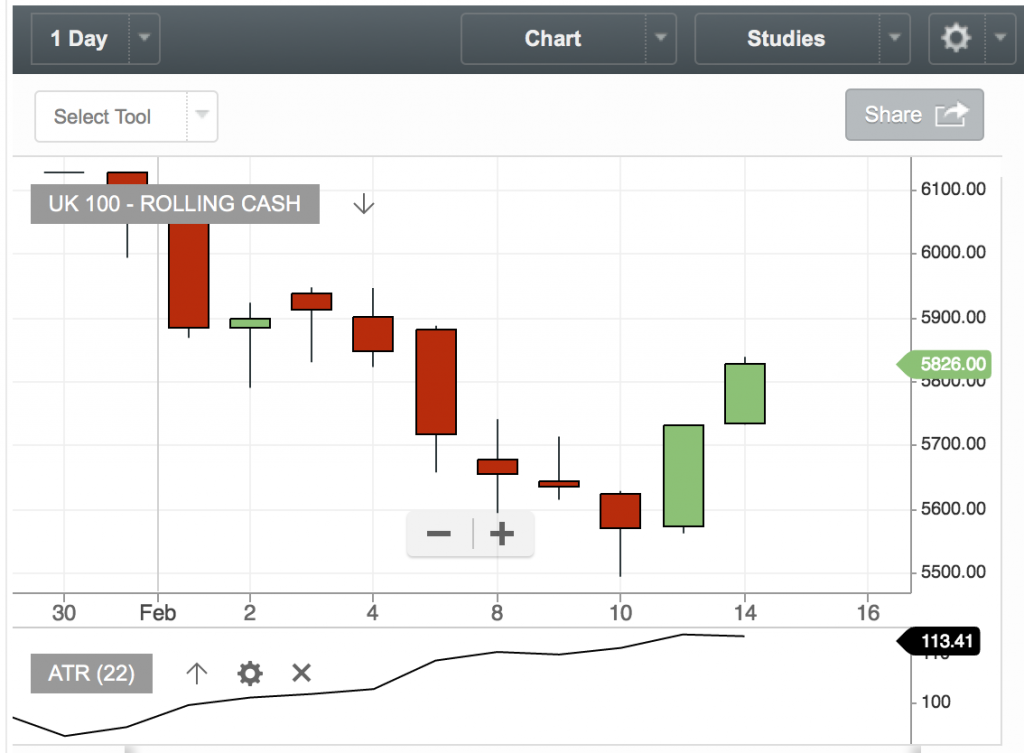
To ensure we’re a safe distance away from this, the chandelier system multiplies this figure by 3. So, if your ATR is 113 (as it is on the daily FTSE chart above), then we’ll have a figure of 339.
But for the Chandelier exit, we don’t take this figure from the current price.
Instead we take it from the extreme high or low of the past 22 periods.
If it’s a buy trade, we’ll subtract that number from the high of the last 22 periods.
If it’s a sell trade, we’ll add that number to the low of the last 22 periods.

The highest high of the past 22 days is 6127. We take 3×113 from this level, to get at stop level at 5788.
For a sell trade, it works like this …

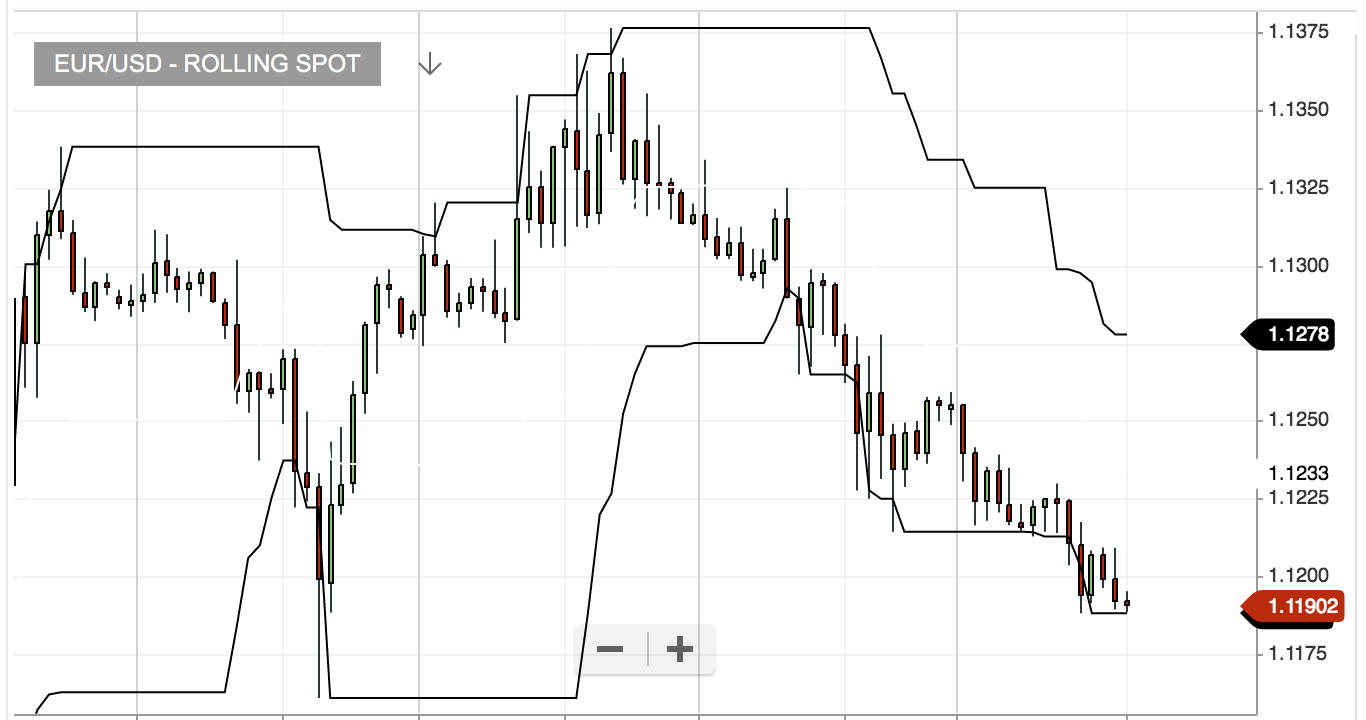
In the hourly chart above, we have an ATR of 22 pips. 66 pips is then added to the lowest low of the past 22 periods (1.1188)
1.1188 + (3 x 0.0022) = 1.1254
This gives us our chandelier stop at 1.1254
Speeding up the calculations
Now, this probably sounds like a bit of a fiddle to be managing at 7am in the morning, while you’re adjusting your daily trades. Yes, this can be automated on MT4, but there are some tools on our bog-standard charts we can use to help us.
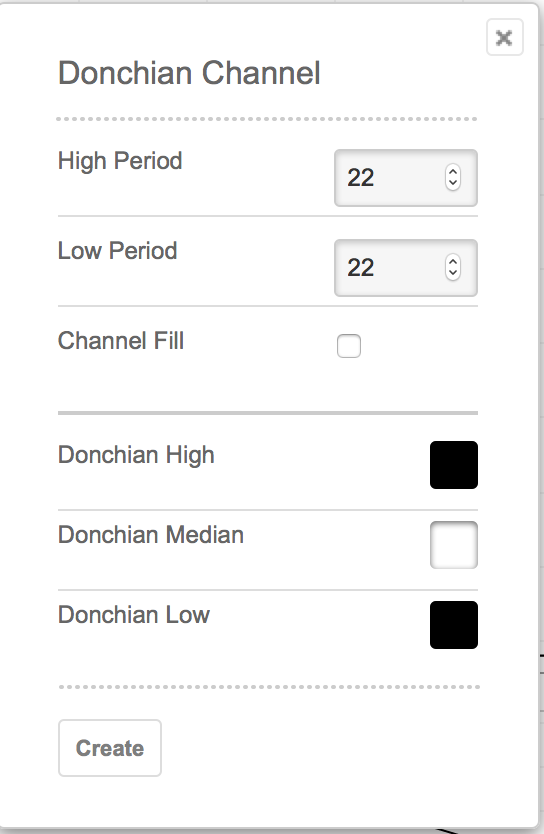
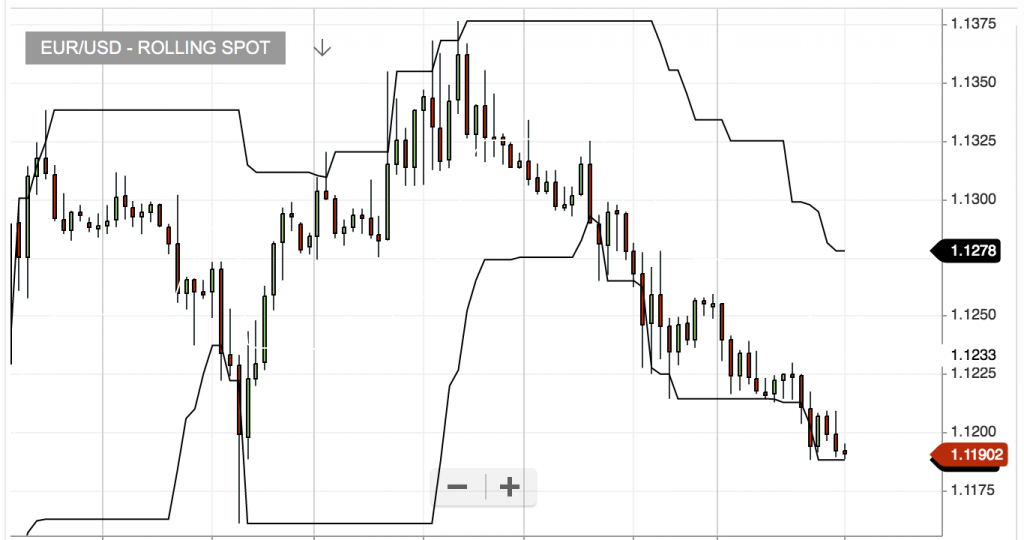
The first is the Donchian channel. You can find this under the ‘Studies’ menu, and set the high period and low period to 22 – this will plot the highest high and lowest low of the past 22 periods. These are the levels we’ll be calculating our 3xATR from.
This is what the Donchian channel will look like …
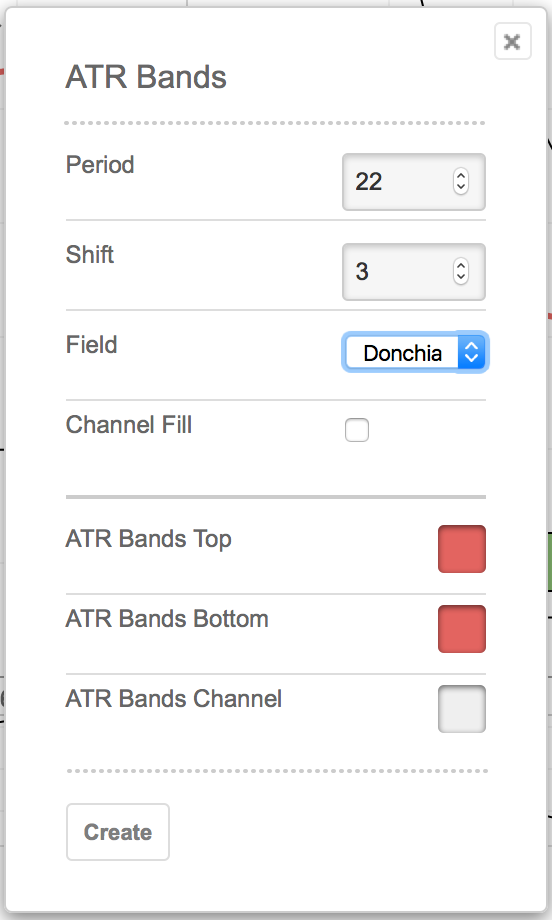
Next, we’ll set our ATR Bands (again, you can find this in the ‘Studies’ menu). The settings for this will be 22 periods and a shift of 3. If we’re in a buy trade, we’ll want to offset this from the High Donchian Channel field. If we’re in a sell trade, we’ll want to offset this from the Low Donchian Channel field. (Remember: this would need adjusting in your settings according to whether you’re buying or selling – using two ATR bands on your charts will allow for this, but I recommend switching off the colours on some of the bands, otherwise your charts will get very messy.)
Now we’ll have the stop level plotted on the chart for that particular trade.

Turning the Chandelier Exit into a strategy
The Chandelier exit can be turned into a full-blown trading system, by using the Chandelier lines as entry points as well as exits.
The strategy would specify that a buy trade is entered where the price moves above the chandelier line, closing when the stop is hit.
Here’s a chart where I’ve added two ATR bands to show the buy and sell Chandelier exits: the blue line is the trailing stop for buy trades; the red line is the trailing stop for sell trades.
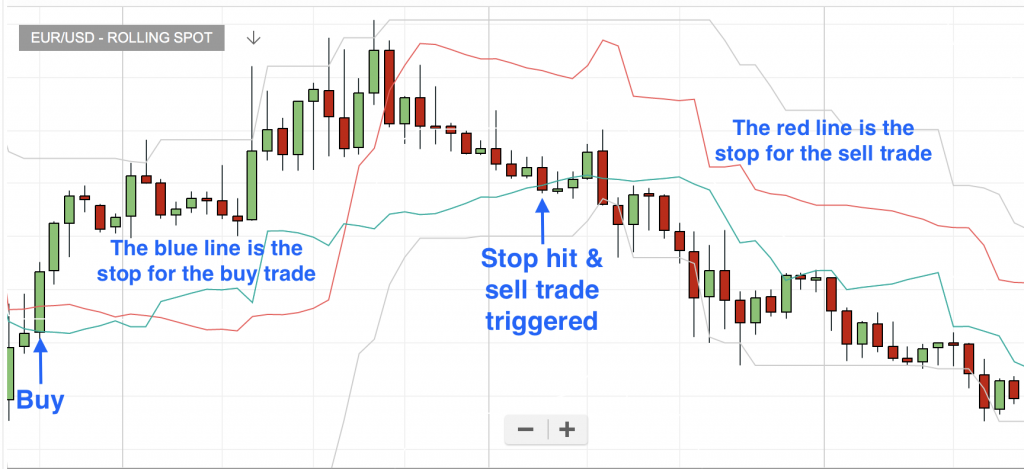
It makes for a very simple trend-following system, but one that will struggle in sideways markets. One of the points that Le Beau was making with his Chandelier exit is that a smart exit is more important than the entry – in fact, his claim was even more significant –that a chandelier exit could make any random entry strategy profitable. I.e. you could blindly enter the markets on a whim, and using the Chandelier exit, be profitable in the long-term.
It’s an interesting theory – and there is some evidence that this random-entry method has worked in the past. If it sounds like a bonkers idea – it’s worth remembering that many traders who sweat over their entry criteria, will then go on to rely on a ‘random exit’ strategy, just snatching at their profits when it feels right.
Personally, I prefer the idea of a smart exit AND a smart entry.
Risk-Reward
Something really interesting about using the ATR to manage your exits is that it brings your risk-reward profile into focus.
Many, many traders still insist on a positive risk reward ratio (i.e. a larger distance to their profit target, and a smaller distance to their stop). But once you’ve drawn your ATR levels onto a chart, you clearly see the error in this. The tighter our stops, the more likely they are to be hit. (If you doubt that tighter stops cost you money, please check out this post.)
Instead, I recommend a wider stop, combined with a technical exit, so those wide stops are rarely actually hit. This way, your stop will get you out if the market shoots off unexpectedly, or if you get trapped under a heavy piece of furniture and can’t reach your computer to close a trade.
But most trades should be exited technically – as we talked about last week, looking for momentum drop-offs.
By trading this way, it might appear that you’re trading with a negative risk-reward profile, but when you actually look through your trading history, you can expect to find that, in fact, your losing trades are often being closed out way before stops are hit, which gives a boost to your all-important positive expectancy – which is the REAL measure of your trading prowess.
Save
Save










2 comments
Paul H
Great post ! Often heard of the ‘chandelier’ but never really looked into it. An alternative exit strategy above would have been to exit on the chandelier sell signal…?
Mike
Thanks for following up on my query about this last week. This website & your newsletter really are a great resource for my trading education – just wish I’d foudn them earlier!