March 18, 2016by Mark Rose- 6 comments
A simple Stochastic strategy

As oscillators go, the stochastic is quite a favourite among many traders.
But it’s often applied in the wrong way, or in such complex strategies that you lose track of what you’re actually looking at! This beautifully pared back system uses the Stochastic as a trigger to get you into a trend, and proves to be a very simple but smart way to trade.
Stochastic is a momentum indicator which gets its information from the highest high of the last “x” number of periods (14 is the default setting), the lowest low of that period, and the closing price of the last candle.
When you put it up on your chart, you’ll notice that there are two lines – the second one is the moving average of the first, which makes it the original line the ‘fast stochastic’ and the second one the ‘slow stochastic’.
The theory that the stochastic indicator works on is that, if the market momentum is upward, then the price is likely to close nearer the recent high. If momentum is downward, it’s more likely to close nearer to the recent low.
Obviously, no indicator is infallible, but Stochastics work pretty well for what they set out to do.
If you’re not familiar with oscillators, they give us ‘overbought’ or ‘oversold’ signals, as they swing from one extreme to the other.
The idea is that we’ll sell if the market is overbought, and buy when it’s oversold.
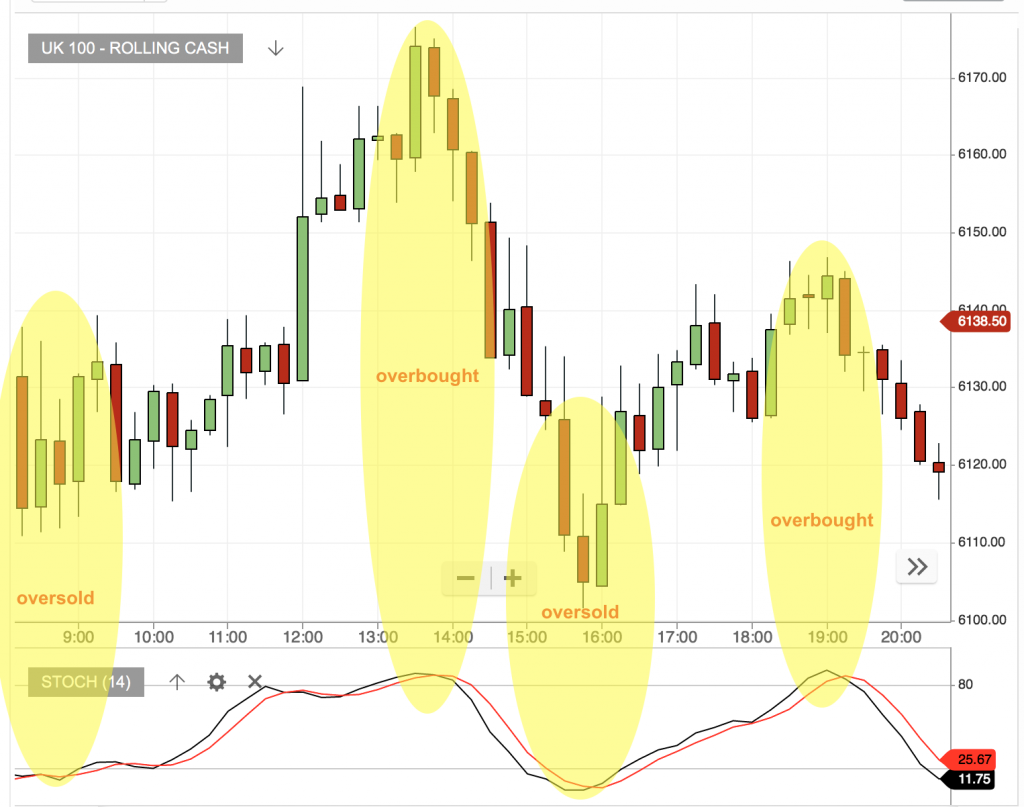
Ah. If it were so simple!
The problem with oscillators is that markets get stuck in overbought and oversold conditions for lengthy periods, when a good trend is underway – and this weakness can cause many traders to rashly strip these handy indicators from their charts.
As you can see in the chart below, trading like this could be costly …

But if you use them properly, trading in the direction of the trend, you’ll quickly forgive the Stochastic for its weaknesses.
Here I’ll show you a dead simple Stochastic technique, we combines with Stochastic with one other charting element – the trend line.
So, as long as you can join up some points on your price chart … add a Stochastic … you’ll be able to apply this strategy. Here’s how …
Stochastic Strategy for getting into trends
As we’ve seen, you don’t want to use a Stochastic blindly – else you could be buying and buying into a down trend … or selling and selling into an uptrend.
Instead, we’ll look for a market that’s trending, and then use the Stochastic to time our entry – this should get us into the downtrend at an optimum moment.
First off, you’ll need to draw a trend line onto your chart.
How to draw a trend line
A trend line is just a method of making some sense out of the directional movements we see on our charts. They can go up or down – an upward trend line will connect a series of higher lows. A downtrend line will connect a series of lower highs.
Before we start breaking the trend-line-drawing rules … I’ll tell you want the ‘rules’ are …
- A trend line needs to touch at least three times.
- The more times the price bounces off the trend line, the stronger its support or resistance becomes.
- The steeper your trend line, the less reliable it is.
Here are some examples …
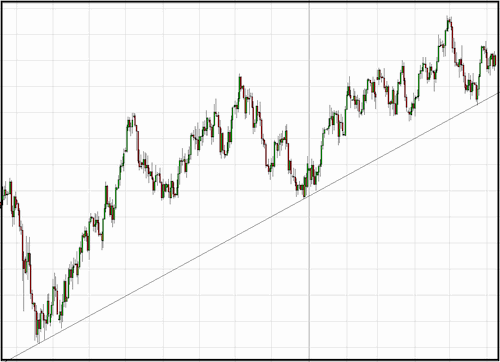

Good trend line drawing comes with practice and some trial and error – always be prepared to redraw your trend line. And in real life they tend to be a bit more messy than the ones in the text books.
That said, don’t try to force a trend line where there is no clear pattern – we want to be patient and wait for the perfect moment, rather than trying to dream up a trade opportunity, where, in fact, the signal just isn’t strong enough.
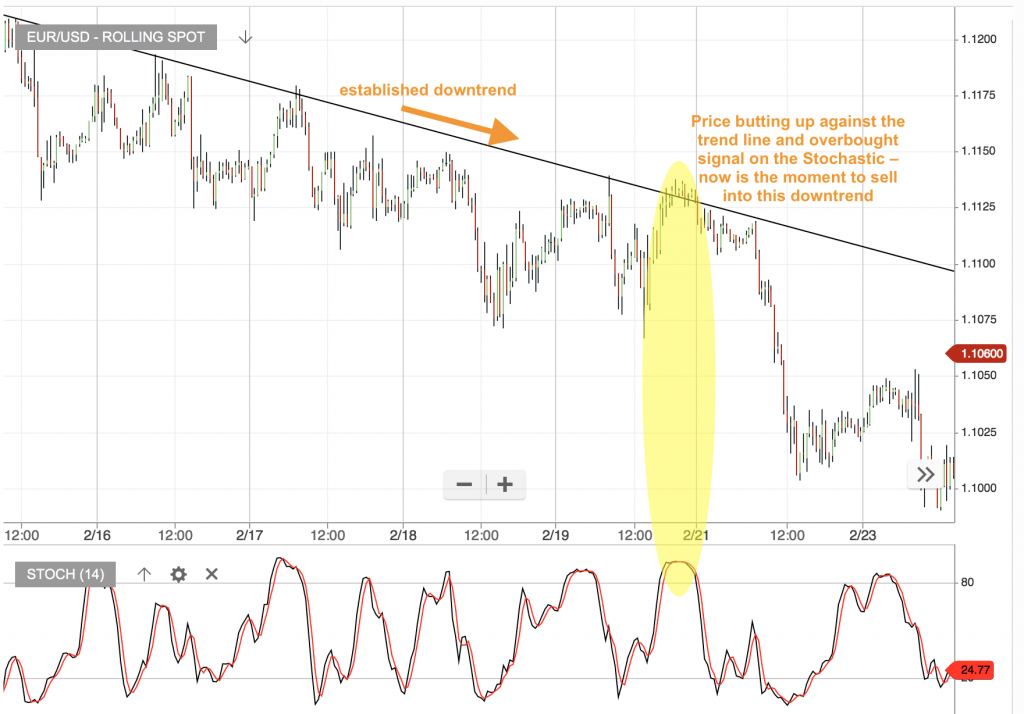
Here we have a downward trend line in place, with the Stochastic indicator on the chart.
We’re looking for the points where the price is pushing up against this trendline AND the Stochastic indicator tells us that the price is overbought.
This combination tells us this is a good moment to get into a sell trade and ride some of those short profit opportunities.
Here’s how it works in practice …
And here’s the same technique used in an upward trend …

Where the fast Stochastic crosses over the slow Stochastic, we have our entry signal.
This technique is beautifully simple, works in any timeframe, and with good money management can be highly effective. It can get us into an established trend, following a pullback, with some momentum in the trend direction.
Because the trend is already established, we’re likely to have some clear support or resistance levels built up behind us, which can guide us on the placement of stops.
Best of luck with using this. Please let me know how you get on, or if you’re already using an adaptation of this method, I’d love to hear about it.
Plus, please don’t forget to check out the latest PIE results on the review page when I post them at lunchtime.
To enjoy more content and get it faster
Save











6 comments
Paul H
CORRECTION: The long entries on the last chart have additional confirmation from previous resistance / OVERBOUGHT price peaks which have become support i.e. very reliable entries
Paul H
The long entries on the last chart have additional confirmation from previous resistance / oversold price peaks which have become support i.e. very reliable entries
Mark Rose
Hi Darin, Thanks for your comments. The 80/20 levels on the Stochastic are all we’re looking at – i.e. over 80 for overbought and under 20 for oversold. I agree that the crossover of the fast and slow make a good entry and I’d also agree that a Fib extension would make a good exit. As you’re trading a pullback, there should be a clear recent high/low to work from, and may be worth taking partial profits at that near level of support/resistsance. I’d be interested to hear how you find this. Cheers, M
Darin
Another nice little system Mark. I like the simplicity of this (fits in nicely with your article last week about we over 50s!), however a couple of queries:
Do the numbers on the stochastic chart play any part here or are we just looking at the line crossover overbought/oversold?
What about the all important exit signals? Looking at the charts you have here (haven’t looked on my own charts yet) it looks like using the fast line crossing the slow line as an entry looks good, but using it as an exit also wouldn’t always work very well. a few false signals there. Use a fib extension/price action based exit do you think?
Tim
Would you also use a break of the trend line to get into or out of a trade at a major turning point?
Mark Rose
Hi Tim, In terms of getting into a trade, I’d say no. Depends what you mean by major turning point. How would you know it’s a major turning point, or just a false break through the trend line? This strategy is about following the trend, which is a lot easier to do that judging a turning point. I’d also beware jumping out of a trade when the price has broken the trend line (unless it’s a significant break) – there are lots of pullbacks to the trend line, and this is often followed by significant momentum back in the direction of the trend.