Six tricks to trade support and resistance reversals like a pro
These 6 advanced-level tips will have you mastering support and resistance levels like a pro.
I’ll show you which support and resistance levels are
more likely to give you a reversal (or not), which are likely to offer the best
profits, and which ones have a bunch of losing traders at them, so you can
hover up their money!
1. One-hit trampoline trades
A question often asked by traders drawing in support and resistance level is: Should I work from the candle body? Or the wick?
The predictably frustrating answer to that question is: either, or both.
Generally, when drawing in our support or resistance
levels, we’ll match up the points that, well, match up. Sometimes it’ll be a
wick, often it’ll be the close of the candlestick body. But if you’re drawing a
support/resistance level with a candle wick poking through it – don’t ignore
that level altogether.
Those errant spikes can come in very useful.
Let’s think about what’s going on here … these are price levels where there’s no consolidation, no push and pull between buyers and sellers. There’s no doubt at these levels.
Here’s another example …
These spikes are outside the main area of price
action, so may not come into play as often, but when they do, the rebound can
be powerful. It’s worth being aware of them.
2. Obstacle-free profits
Here’s a scenario … the price is approaching my
support level with some very powerful price action – a run of long red candles.
It looks very bearish.
Surely this is a breakout setup?
In fact, this is exactly the set-up that a reversal
trader wants.
The great thing about a powerful move towards support
or resistance is that it clears the path for our trade in the reverse direction
– it’s not littered with resistance or support levels that could hinder our
profits.
Here’s an example …
Because the price has moved quickly and decisively
down to this support level, we don’t have areas of consolidation on the way
that will cause resistance to our buy trade.
Of course, we can’t know whether the price will
breakout or bounce, but what we can know is that these set-ups will offer the
best profits – and smart trading isn’t about knowing what’ll
happen – it’s about working out where we’ll get the best chance of success.
3. Hunting down losing traders’ stops
So, if we’re able to spot opportunities where there
are few obstacles to our profits … we can go one better by finding
opportunities with acceleration points for our profits!
These little acceleration points are where we’re
taking out the stop loss levels of other (losing) traders.
Let’s look at the example above again …
The strong move down actually broke through the
support level, and that big bearish candle closed BELOW support.
This will have triggered many breakout traders to sell
here. As a reversal trader – our first thought should be about all those stop
orders positioned above that support level – these are like little pots of gold
waiting for us to collect them!
4. Avoiding low-probability set-ups
So, how can we know whether the price will bounce or
break our level?
The reality is that we don’t know – but there are
clues as to which levels might be weaker and worth avoiding.
Warning signs should be a series of lower highs
approaching a support level, or a series of higher lows approaching a
resistance level.
Like this …
5. Double-up levels
When we get two support levels, or two resistance
levels very close to each other, we can find high-probability set-ups.
In the example below, we can see two rows of sellers lining up …
If we sell at the lower level, we have confidence that
there’s another line of defence behind us, ready to push the price lower if it
strays upwards.
Again, we’re increasing our chance of success
– and we have the advantage of a great place to position our stop level
for a good risk-reward ratio.
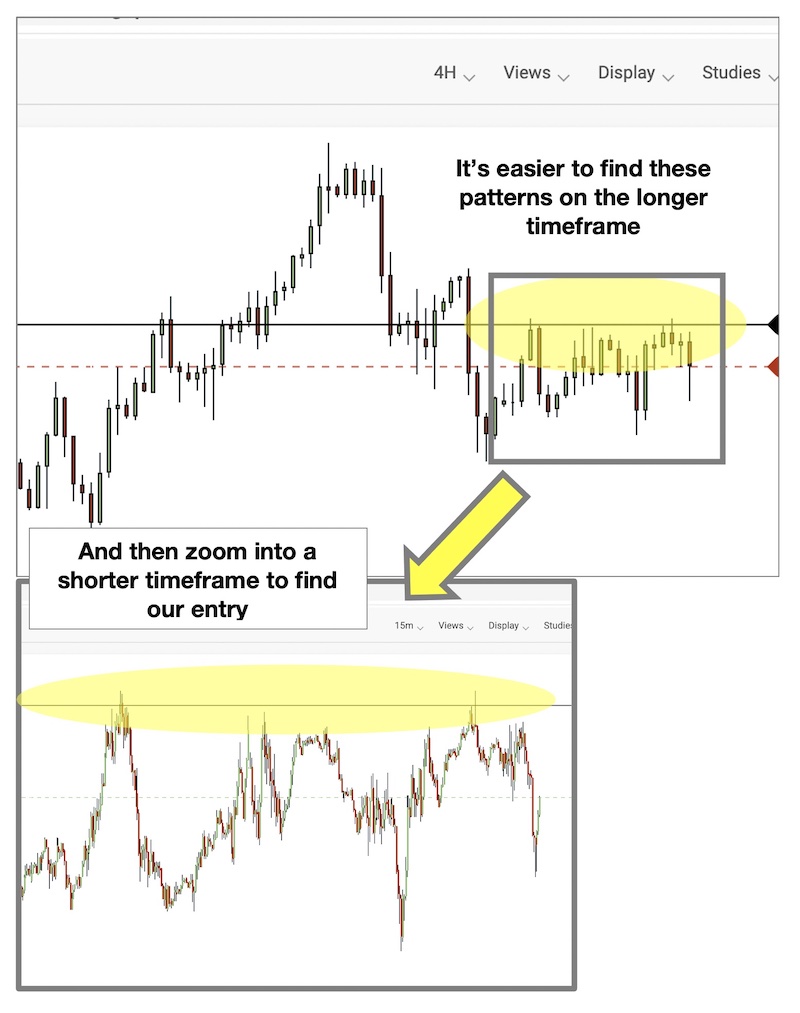
6. Higher timeframes
If you’re struggling at any level to spot these
set-ups forming on your charts, the best way to find high-probability set-ups
is to switch to a longer timeframe.
If you’re trading 15 minute charts, look on a
4-hourly. If you’re trading hourlies, switch up to daily.
On the longer timeframe, you’ll more easily be able to see consolidations as they happen, along with the outliers from those patterns.
For anyone looking at S&R levels, being able to
switch between timeframes will give you a huge advantage in judging the more
powerful levels and finding all the nuances I’ve talked about here.
But how will you know if it’s a bounce or a break?
Powerful as these techniques are, I can’t stress
enough that none of them can tell you what’ll happen.
What they can do is warn you away from weaker signals,
and enable you to make the most out of the best signals.
Profitable traders don’t know what’ll happen, but they are perfectly positioned to take advantage of the trades that go their way. If you master the techniques here, you’ll be able to trade off levels as well as any seasoned trader.










3 comments
Rakesh Muthappa
Very clear and genuine information, thanks a ton
Mark Rose
Thanks for the feedback Rakesh – glad you found this helpful
Cyril
Very Very informative,i think I like that