For many of us, moving averages are the first indicator we use – they’re simple to understand, easy to use, and help us to visualize market directions.
But they are also one of the first trading tools that tend to be discarded.
Too basic …
Too slow …
Flashier, more sophisticated, and more complex indicators quickly replace them – tools that promise to give us early warning of market moves.
But it’s a mistake to dismiss moving averages – I still use them every day.
We just have to use them correctly.
Moving averages 101
A simple moving average is created by adding up the closing prices of ‘X’ number of candlestick periods, then dividing the result by ‘X’. So, a 20-day moving average, is the average closing price over the last 20 days … a 50-period moving average is the average closing price of the last 50 candles … and so on.
Whatever timeframe you’re looking at – daily, hourly, 5-minutes – it’s an average of the closing prices of ‘x’ number of those candles.
These figures are plotted on our charts to create smoothed-out lines of price movements.
The fewer the periods we’re averaging out, the more reactive your moving average will be. So a 10-period moving average will respond quickly to price changes, while a 200-day moving average barely notices to daily twists and turns.
That’s a simple moving average. It also comes in weighted, exponential triangular, Welles Wilder and Hull flavours – each with a different degree of weighting towards more recent data.
Here’s a selection of 50-period moving averages, all subtly different …
If that leaves your head spinning – don’t worry. My advice is to not sweat the type of moving average too much – if your MA is too jumpy, look for a longer period or add some smoothing. If you want faster reactions, consider fewer time periods or using a weighted version.
As we’ll see, it’s less about what you’re using … and more about how you’re using it.
What NOT to do when using moving averages
First up, let’s consider the things that moving averages do badly – that way we know not to rely on them in these scenarios.
1 • Catching new trends
Moving averages are LAGGING indicators, which mean that they do nothing more than tell us what prices have done. They promise no kind of predictive power – they just tell us which way the markets have moved, but in a smoothed out line rather than jumpy candlesticks.
So, if you want to catch a new market trend, a moving average is only going to let you know once that trend has formed – so you’re going to be late to the party.
2 • Monitoring sideways markets
Moving averages may be sluggish with spotting new trends, but put them into a sideways market and the wheels really come off. Moving averages struggle to give us any useful information in directionless markets.
So, what do they do?
So, if moving averages can’t spot new trends, and they can’t help in sideways markets … what can they actually do?
Well, the good news is that markets spend very little time forming new trends, and they spend a good chunk of time in established trends – which is exactly where moving averages help us.
Here’s how it’s done …
Trading with the trend
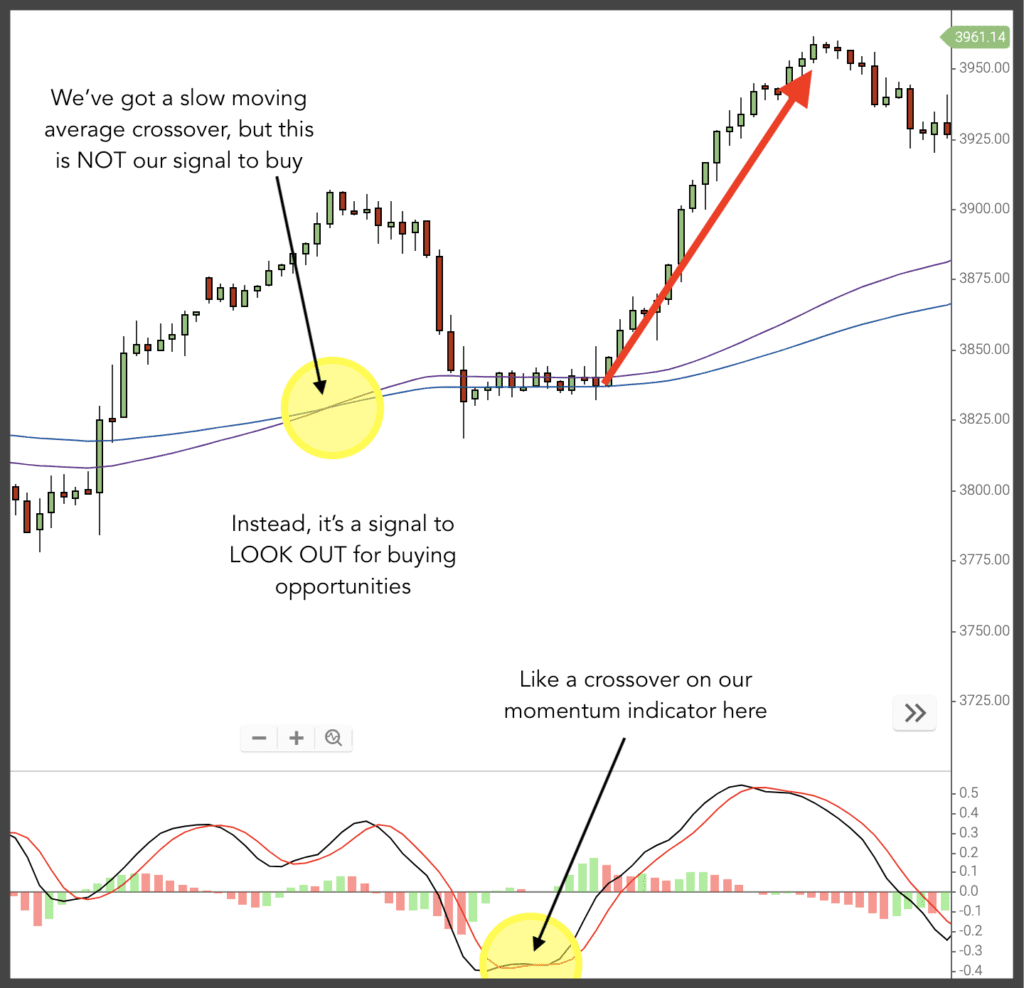
As we’ve seen, moving averages aren’t great for catching the beginning of a trend, but once we have an established trend – as shown by our moving average – we can pick up profits as retracements pull back into the direction of the trend.
Here’s an example, where the moving average advises us which direction we want to be looking for trade opportunities in – this is where the market moves are.
The moving average crossover isn’t an entry signal – we want to wait for a retracement and see the market pulling back into its trend with some momentum – that’s when we’ll act.
Support & resistance
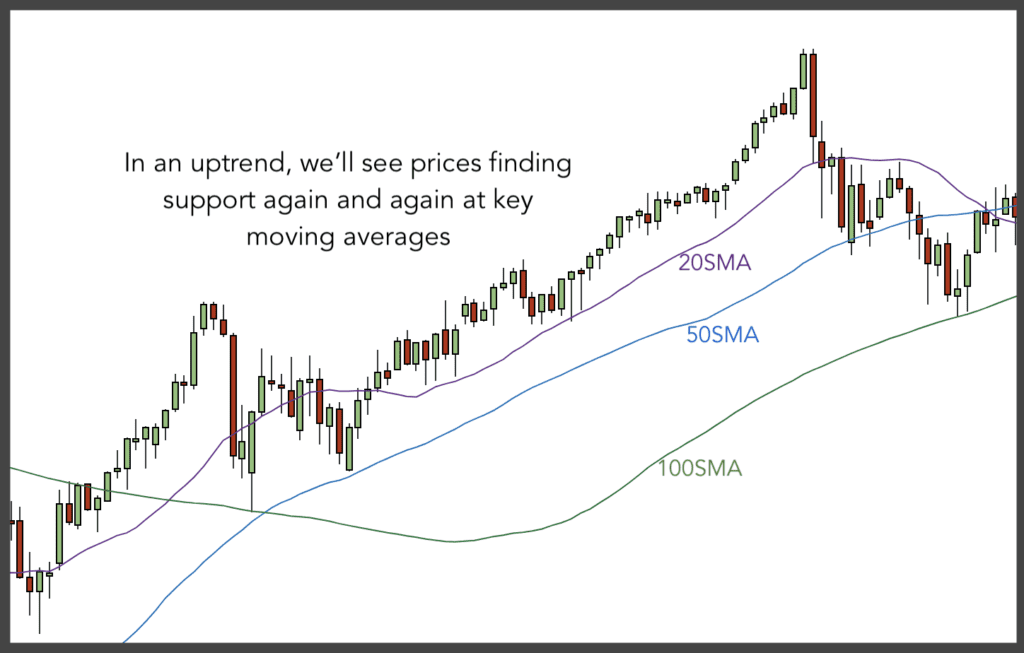
Support and resistance levels are arguably the strongest indicator we have of price behaviour. When prices have bounced or stuck in the past, they very often will again in the future.
But in trending markets, we may find ourselves without any recent or significant support or resistance levels. In this kind of uncharted territory, we can call on major moving averages (this means picking a nice round number like 10, 20, 50 or 100) where our prices can find support.
The image above clearly shows the powerful effect moving averages have on price behaviour – these aren’t indicators to be dismissed.
When we recognise the weaknesses of our indicators, we can use them the RIGHT way, and combine them with other tools for maximum profits.
If you aren’t using moving averages in your trades, I strongly recommend that you add them.
And if you do use them – I’d love to know what works best for you – just leave a comment below.










1 comment
RAJEEV LOCHAN
A very fundamental contet. looking simple still doing miracles.