Price action trick to add market sentiment to your trading
Price action traders and technical traders are pitched as two distinct types of beast.
Technical traders have their charts covered in indicators, searching through past data for patterns … while price action traders are looking at what’s going on right now, and making rapid decisions based on market sentiment …
But the truth is that both styles have their strengths and their weaknesses, and if we combine the two, we can get the best of both worlds.
Here I want to show you how easy it is to add price action triggers into any technical trading strategy. You don’t need to understand lots of chart patterns – in fact, I’m not even going to mention a ‘pin bar’, ‘doji’ or any candlestick type. It’s really much simpler than that.
What the candles are telling us
If you’re completely new to price action, the basic facts here are all you need.
If you’ve used price action before, then I believe you’ll find this a much simpler and more intuitive way to apply it.
Every candlestick on your chart represents a block of time. If you’re looking at a daily chart – each candlestick is a day. If you’re looking at a 5-minute chart, each candlestick represents 5 minutes … and so on.
Within that candlestick, you can find information about where the price stood at the beginning of that time period … where it stood at the end of that time period … and any extreme highs or lows it reached during that period …
Not all candles have wicks. If the price opened at the low, and closed at the high, then you’ll have a solid green or white wick-less candle. A wick-less candle suggests a market with a clear direction.
But most have either an upper or lower wick, or both. These thin lines tell us that during that period, the price moved up or down … and then turned around. It tells us that trader sentiment is changing.
The longer the wick, the greater the change in sentiment.
A long upper wick shows a failed attempt to drive prices higher, which suggests that sellers are taking control.
Likewise, a long lower wick shows that prices fell, but buying pressure came back into the market, bringing prices back up – this suggests that a support level has been hit and we could see prices driven higher.
Where the wicks are long on both sides of the candle, again we see a battle taking place between buyers and sellers, but in this instance, there’s no clear winner.
This is how, by just looking at a single candlestick – without worrying about spotting any particular types or patterns – we can judge market sentiment.
Where to look
The trick to applying price action is knowing where to look for it.
With every tick on our charts, there are signs of market sentiment, but to turn this into a successful strategy, we need to look for the signs in key places.
And this is where technical trading comes in. We want to apply the price action tricks at the points where our technical indicators are giving us buy or sell signals.
By adding this feature in, we’re filtering out the weaker signals, and putting our money behind the trading opportunities with market sentiment in their favour.
Timeframe flexibility
Often, to find market sentiment at the moment we want to pull the trigger on a trade, we’ll need to adjust our perspective.
This can mean switching to a slightly shorter or a longer timeframe. Don’t zoom in or out too far. (Looking at sentiment over the last 5 minutes isn’t going to be relevant to a trade that’ll play out over days.)
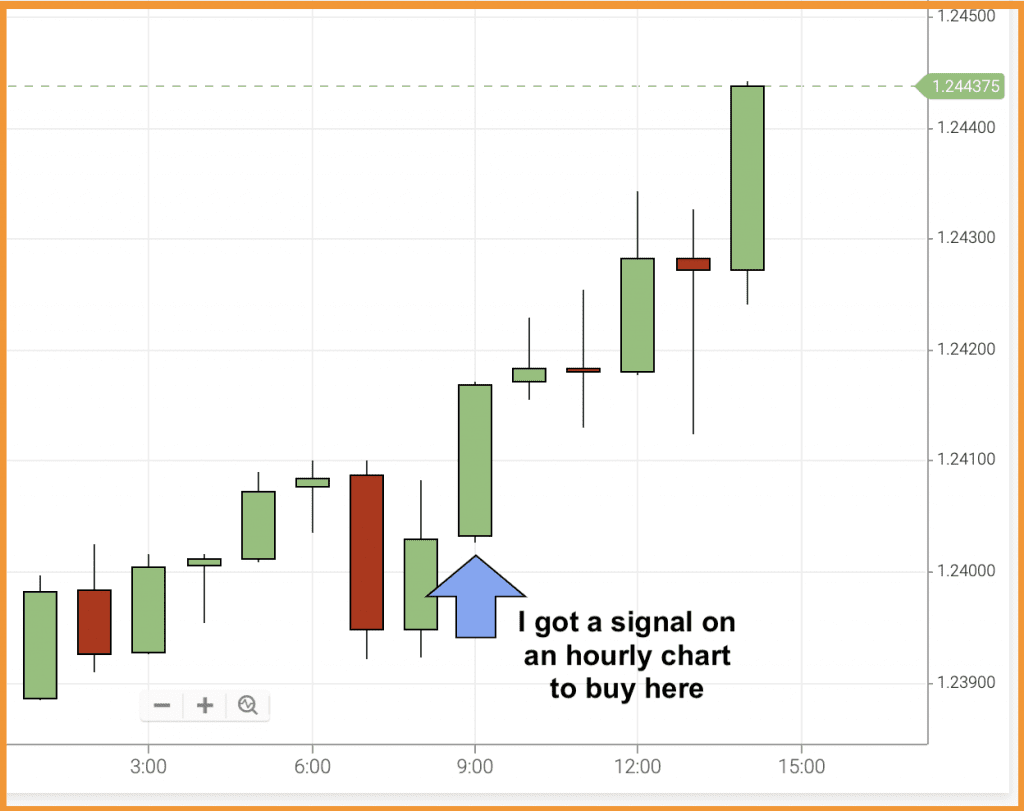
Here’s an example from a trade that my technical indicator signalled yesterday morning …
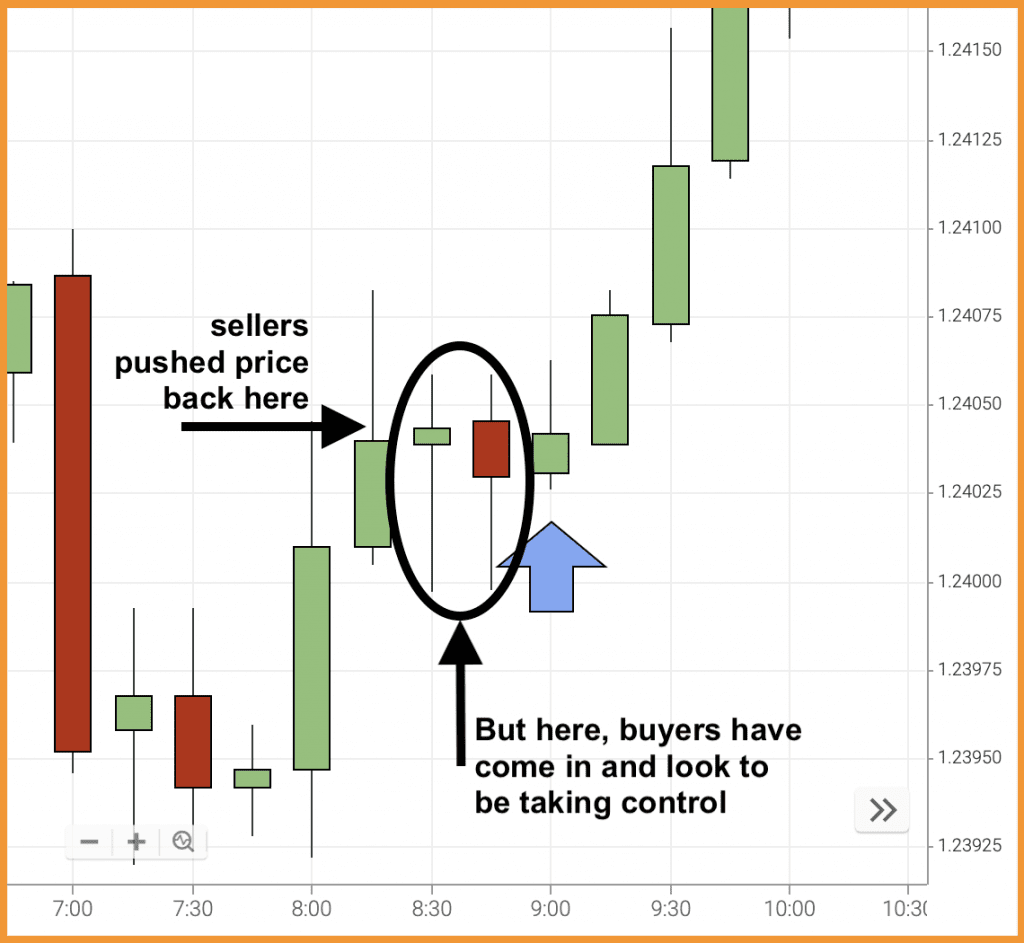
In terms of wicks, those couple of candlesticks ahead of this signal aren’t giving much away. But if we switch to a different timeframe, more information becomes apparent.
Here’s the same signal on a 15-minute chart …
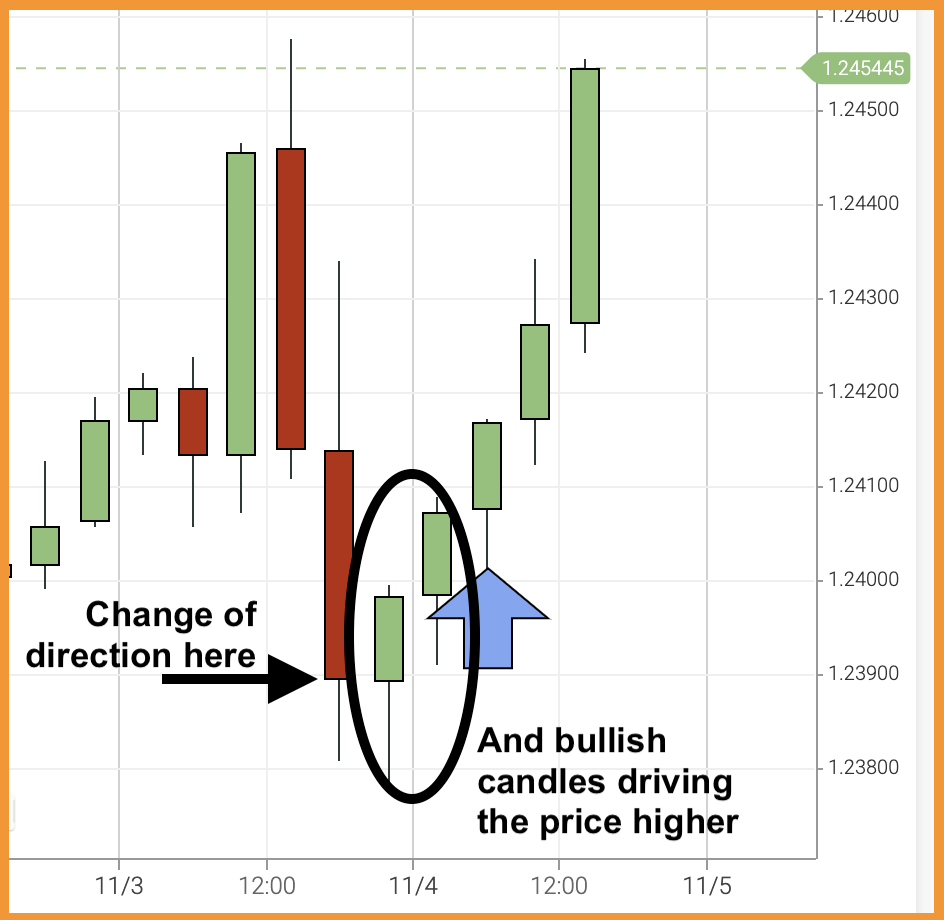
And here on a 4-hourly chart …
By subtly shifting perspective before we pull the trigger on a trade, we can get that extra bit of confirmation that market sentiment is behind our decision.
Don’t expect to have perfect long-legged candlesticks to confirm every move, but by adding this check, you’ll be honing in on the best trade opportunities, and dodging the weak ones.