The secret to shadow trading: fast, intuitive, price-action trading skills
If you’ve ever stared at a candlestick chart and wondered what crucial price action signals are hiding within it … you’d be in very good company.
There are libraries of study devoted to candlestick patterns, and it’s easy to feel that – if only we could learn to recognise all of them – we’d be able to unlock the secrets to trading success.
The reality is that reading price action can be much simpler than that … if you just know what to look for.
‘Intuitive’ trading decisions suggests that we’re relying on some kind of subjective wisdom … but that’s not what I’m getting at here. I’m talking about being able to get a ‘feel’ for the markets quickly and easily because you have such as sound understanding of what the charts are showing.
It’s like driving a car … you don’t have to actively ‘think’ about what you’re doing all the time, because it’s become second nature.
And when you know … you’ll get it …
With this simple shadow-trading method, you’ll never have to remember a candlestick pattern again. And, instead of trying to figure out what the charts are telling you – you’ll be able to read price action without thinking about it …
What’s shadow trading?
Shadow trading homes in on the candlestick wicks.
We’re interested in the thin black lines poking out of the bottom of each candle – these tell us the extremes of price during that period, and show us where trading began and ended up.
We’re not going to worry about whether we have a doji or a marubozu, a shooting star, or whatever else … all we want to know is:
how big are the wicks
and how does the upper wick compare to the lower wick
That’s it!
All we need to know about investor sentiment is contained in the wicks (or shadows) of our candles.
What’s in a shadow?
Not all candles will have wicks. If the price opened at the low and closed at the high, then you’ll have a solid green, wick-less candle.
If the price opened at the high and closed at the low, you’ll have a solid red wick-less candle.
A solid wick-less candle suggests a market that knows where it’s heading. A string of these candles in a row can be a sign of a strong trend getting established.
But most candlesticks will have an upper wick, a lower wick, or both.
The wicks, or shadows, are associated with a change in sentiment during that period. As prices are moving up, a change in the views of traders means that they’ve been pushed back down towards the open or close – thus forming an upper wick.
Similarly, as prices are moving down, a change of market sentiment sees the price pushed back up towards the open or close level – forming a lower wick.
The longer the wicks, the greater the change in sentiment.
Balancing shadows
The next element to consider is the balance between the upper wick and the lower wick. Which one is bigger?
A long upper wick shows a failed attempt to drive prices higher, suggesting that a bullish trend may be coming to an end.
Long lower wicks show that prices fell, but buying pressure came back into the market, bringing prices back up – this suggests that a support level has been hit and we could see the end of a down trend.
Where wicks are long on both sides of the candle, we see a battle taking place between buyers and sellers, but with no clear winner. These signal indecision, and the potential for an explosive breakout.
Combining wicks with technical analysis
A neat thing about watching these shadows (or wicks) is that they are extremes, which means they will often come at recent highs or lows. And that gives us the perfect opportunity for extra insight when it comes to technical analysis.
Look for divergence, or lack of it, for clues about where the price is headed …
Shadows are more than just rejections
It can be over-simplistic to classify all candlestick wicks as a price rejection – the price moved to a level, but traders came in a pushed it back. We shouldn’t ignore the sentiment that pushed the price into that wick.
A couple of weeks ago, I posted about supply and demand trading – it’s a mindset that views charts as littered with trader’s orders – and every spike will trigger orders, whether it’s trades being opened or closed, won or lost.
Remember – a candlestick is just a snapshot of sentiment during that period of time. Market sentiment moves on quickly. Beware of expecting too much predictive power from a 5-minute window on the markets.
And, watch out for hidden shadows
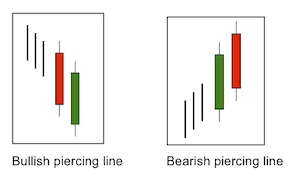
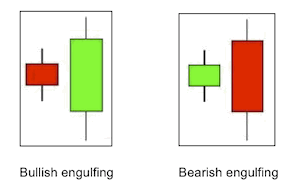
You may be wondering about the hordes of candlestick patterns that your price-action trader loves, which don’t seem to have anything to do with wicks … like piercing patterns, engulfing patterns …
But where we have multi-candle patterns like these, if you switch timeframes, you discover that it’s actually still all about the wick!
Get comfortable with shifting between timeframes when you’re looking at market sentiment – you’ll often find glaring messages to the shadow trader!
A little agility in how you look at candles will allow you to reap the rewards of this fast, intuitive approach to price action, without getting lost in the complexities of pattern-recognition. It’s a smarter way to read market sentiment in your charts, and you’ll find that you have a deeper understanding of trader sentiment and where prices could be heading next.