April 13, 2017by Mark Rose- 5 comments
Forget Price Action: The Candlewick Method is all you need to know

If you study candlestick patterns, you could be forgiven for thinking it’s some dark art,
a bit like finding patterns in tea leaves, or reading tarot cards.
And the patterns all have complex names – often in Japanese, just to make the whole
process even more opaque.
But the truth is that you don’t need to know your marubozu from your dragonfly to get the most out of candlestick reading.
Here I want to show you the two things that matter about reading candlestick charts – and you can forget everything else you knew (or thought you had to learn).
Forget everything you knew about price action
I expect you’re familiar with the makeup of a candlestick chart …

But rather than worry about what text-book patterns are cropping up in our charts, I want to look at just one factor …
The Candlewick
The wick of a candlestick tells us everything we need to know from that candle. It contains the story of what’s going on in the traders’ minds … are they bullish or bearish, hopeful or fearful, successful or failing, sitting on losses they want to offload, or accumulating profits they want to cash in ..?
All this information is contained in those thin black lines.
And I’d like to show you how to decipher it at a glance to make lightning-fast trade decisions.
Wick formation
Not all candlesticks have wicks. If the price during that period opened at the low, and closed at the high, then you’ll have a solid green, wick-less candle.
But most have either an upper or lower wick, or both – this tells us that after that period of trading began, the price moved beyond its open and close levels, before pulling back within the range.
For this reason, wicks are associated with a change in market sentiment. As prices are moving up, a change in the views of traders means that they’ve been pushed back down towards the open or close – thus forming an upper wick.
Similiarly, as prices are moving down, a change of market sentiment sees the price pushed back up towards the open or close level – forming a lower wick.
The longer the wick – the greater the change in sentiment.
The Candle-Wick Scale
When it comes to candlestick wicks – the bigger it is, the greater the change in sentiment that traders are experiencing. So, a large wick on a candle is a wake-up call for traders to take notice of.
The next element to take note of is the balance between the upper and lower wicks – i.e. is one longer than the other?
A long upper wick shows a failed attempt to drive prices higher, which suggests that a bullish trend may be coming to an end.
 Likewise, a long lower wick shows that prices fell, but buying pressure came back into the market, bringing prices back up – this suggests that a support level has been hit and we could see the end of a down trend.
Where the wicks are long on both sides of the candle, again we see a battle taking place between buyers and sellers, but in this instance, there’s no clear winner. These kinds of candles may not hint at which direction the market will move, but do tell us that there is indecision, which often precedes an explosive price breakout.

Of course, the lack of a wick tells a story too. A solid, wick-less candle signals a market that knows where it’s heading, and when we see a string of these candles in a row we see a strong trend establishing. (Those of you using Heikin Ashi candles will know all about the lovely runs of wick-less Heikin Ashi candles that market are big money-spinning trends!)
Hidden CandleWicks
You may be wondering about the hordes of candlestick patterns that your price-action trader loves, which don’t seem to have anything to do with wicks … like piercing patterns, engulfing patterns …
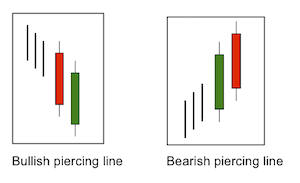
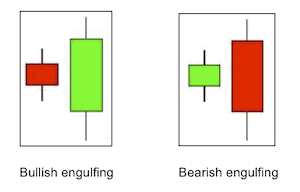
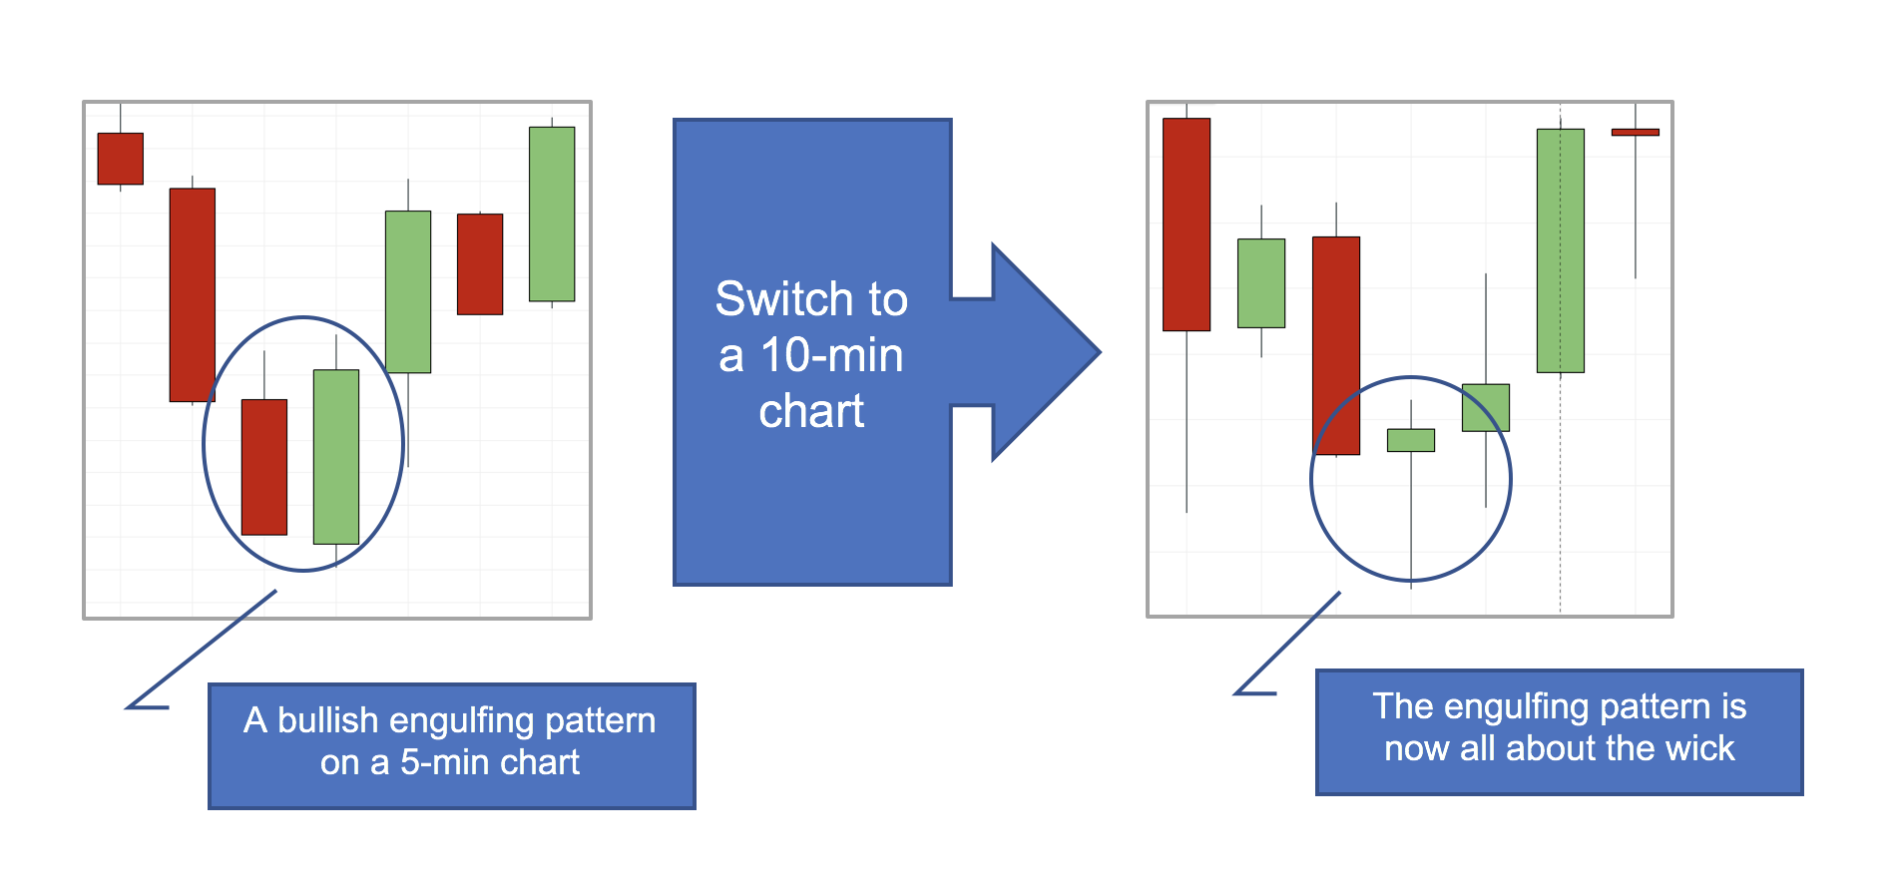
But where we have multi-candle patterns like these, if you switch timeframes, you discover that it’s actually still all about the wick!


By focusing on the wicks, you see that all those complex candlestick patterns that price-action ‘gurus’ try to teach you are nothing more than pretty names. If you see the story of the wicks behind the price action, then you’ll have a much clearer image in your mind of trader sentiment, you’ll have a better idea of where the market could be headed, and you’ll be a more successful trader.
To enjoy more content and get it faster
Save
Save
Save













5 comments
Jacqueline Alexander
Hi Mark, great information shared in a simple and effective lesson.
Mark Rose
Thanks for the feedback. Glad you’ve found this useful.
Mahomed
Hello Mark. Do you have a list of suggested brokers or a few brokers with solid reputation. How important is it to ensure broker is ecn/stp as opposed to market makers. Your guidance would be appreciated.
Mahomed Khan
Paul H
Hello Mark. This is really good information and debunks a lot of the mystique and complexity of candlesticks. Thanks for sharing this.
Mark Rose
Thanks Paul – I’m pleased you found it helpful.