January 23, 2015by Mark Rose- 11 comments
Indicator pairings made in heaven

 If you use technical trading indicators, as most traders do, you probably spend a lot of time fretting over your choice of indicators.
Should we really be risking our money based on what some line on a chart tells us?
Especially when we don’t really understand the maths behind why that line is pointing in the direction that it is?
Perhaps we should scrap our technical indicators, and go bare-back – just trading price action?
Or perhaps we just need to add some extra indicators to make our system work better?
These are the questions that spiral around our brains as we watch trades move into and out of positive territory, day in, day out …
So, what’s the solution?
Which indicators are the best ones? How many do I need? How do I know which ones work best together? Or should I just clear them off my charts completely?
Technical indicators, by their nature, tend to be one-dimensional.
They might be a measure of price levels … they might measure speed of movement … or how wide recent highs and lows have been from each other …
And that’s fine. They’re just doing their own specialist jobs.
Why indicators need to find their better half
Because of their specialised nature, they’ll each have glaring faults – market situations where they repeatedly give false signals.
For example, your moving average, which measures market trends, works beautifully if we have one long trend followed by another long trend …
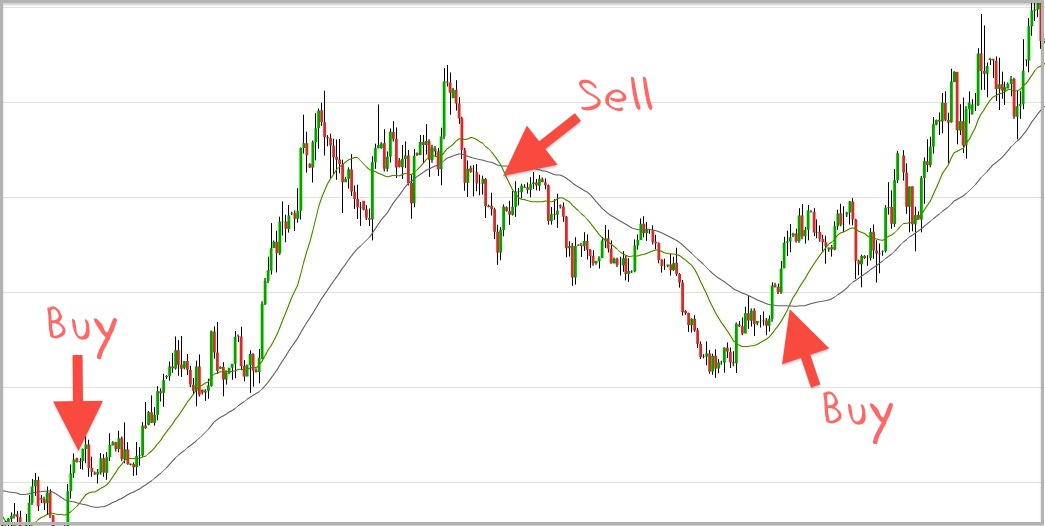
In the chart above, we can see a moving average crossover working just as the text books say it should.
But give it a choppy market, where trends aren’t clearly defined and drift along sideways …
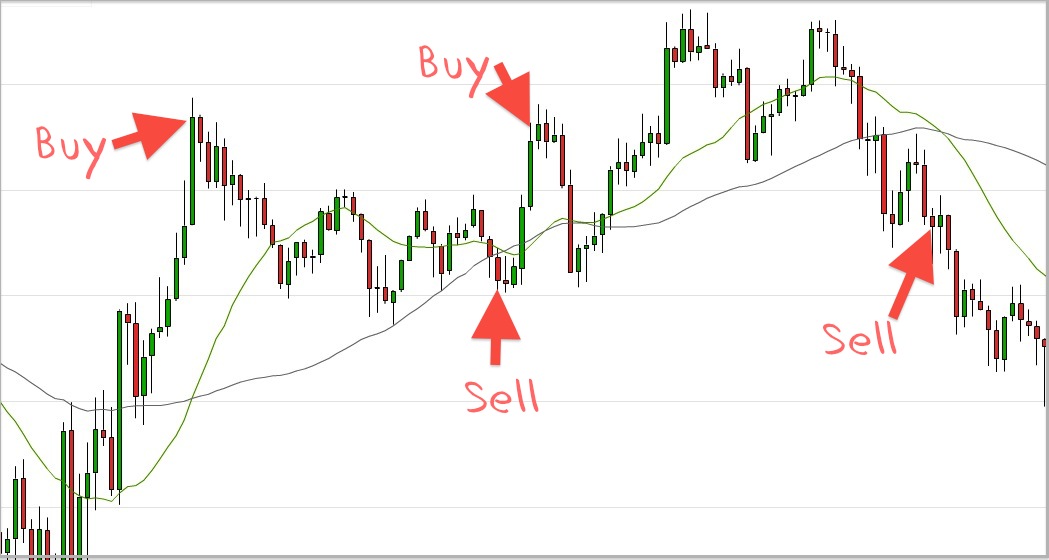
Here, the moving average is getting us into up trends just as they’re peaking … and selling at the bottom of troughs.
The moving average indicator is crying out for a partner that will spot when markets could be drifting like this, and can keep us out of duff trades.
It needs a partner that doesn’t just see price moves, but can measure the strength of that move – whether it’s likely to run, or will be short-lived.
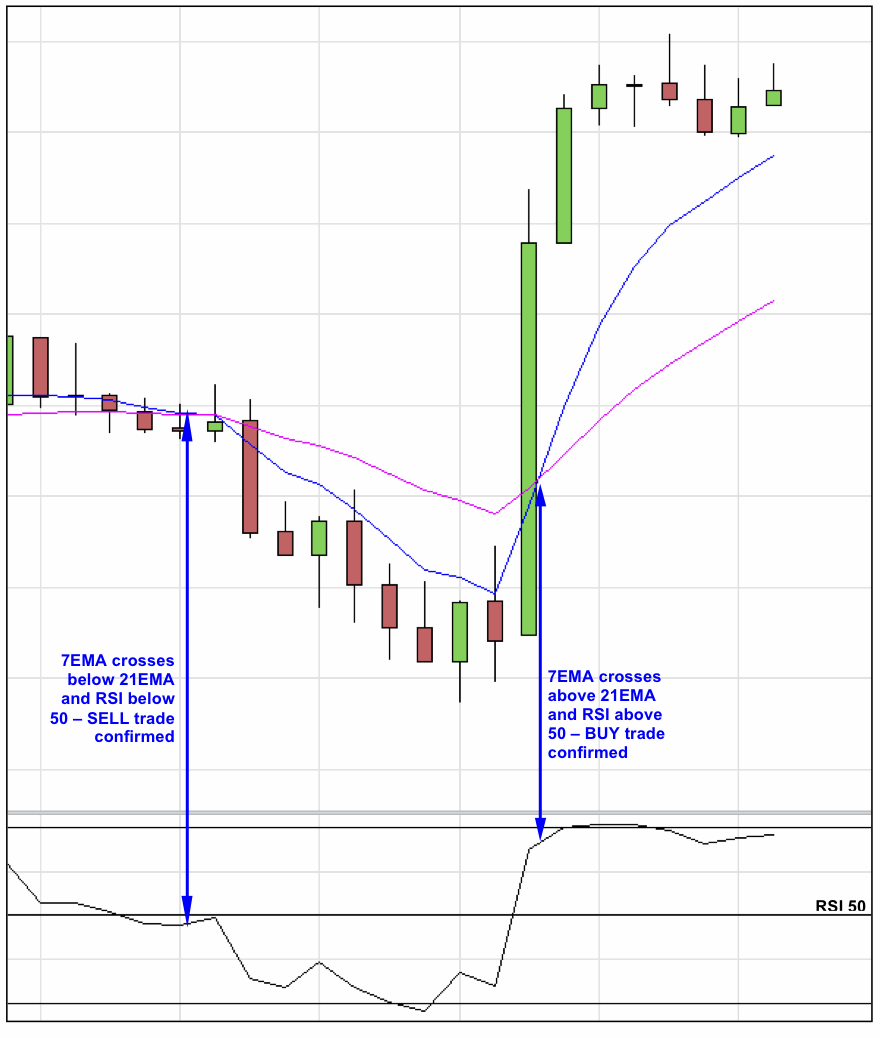
A momentum indicator, like RSI would do this job for us …
When indicators compliment each other too well
If you employ someone who agrees with everything you say, they may do a great job of massaging your ego, but they won’t help you to make better decisions.
And the same is true of oscillators.
If they agree all the time, then they’re not doing their job properly.
In this example, we have a MACD. Because it’s an oscillator, the MACD is often mixed in with momentum indicators, but it’s not one.
Here it’s been combined with two moving averages …
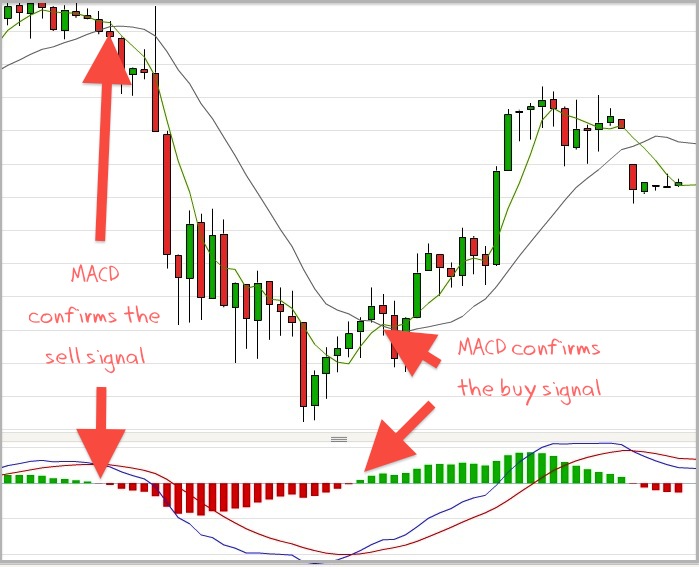
The MACD is really a trend indicator – it measures how two moving averages are moving in relation to each other.
So, if you’re using a MACD just to trade where it crosses the zero line – it’s exactly the same as using a moving average crossover. So, combining MACD with moving averages is just adding extra moving averages – that can give you a more accurate picture of a trend, but it doesn’t bring any new information about price.
A better match …
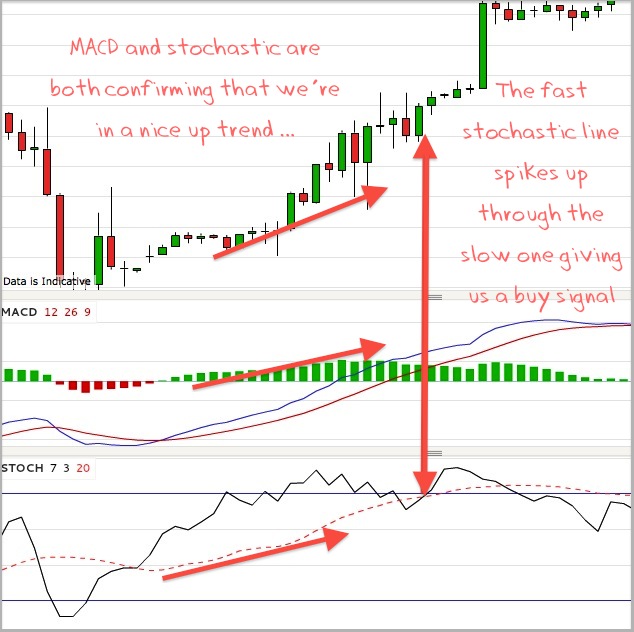
A far better pairing for the MACD would be something like the stochastic oscillator.
Stochastic compares closing prices to the range price, giving a relatively sophisticated tool for measuring the momentum behind a move. Stochastic is good for showing overbought and oversold conditions.
While the MACD is like a moving average crossover, with a few extra whistles and bells. Rather than showing overbought and oversold conditions, the MACD shows the relationship between prices.
So, when these two agree with each other, we get confirmation, rather than just repetition …
The key to combining technical indicators …
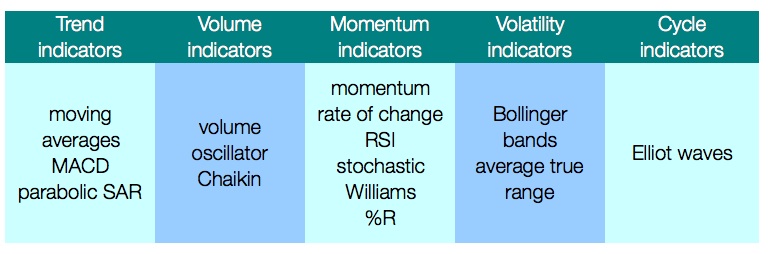
Indicators generally fall into a handful of categories: trend, volume, momentum, volatility, and cycles. The trick to a successful combination is to choose your indicators from at least two different categories.
If you use the chart below as a guide, make sure you have indicators from at least two columns forming your signal …

And a secret weapon …
Okay, not strictly a technical indicator … but price action has predictive ‘right now’ powers that no other technical indicator can match when you’re looking for entries.
Used in combination with technical indicators – a little knowledge of what key candles look like, and what they tell you about market sentiment at that moment will ensure you get into the very best trades.
Likewise, don’t let indicators on your charts cloud your view of support and resistance levels – about the most reliable tools a trader has to work with.
Price action doesn’t have to be a daunting playing field for experts only – if you check out the Trader’s Bulletin concise Price Action guide, you’ll find the handful of key facts you need to know. It’s completely free to all subscribers HERE.
To enjoy more content and get it faster
Save
Save
Save
Save








11 comments
Mark Rose
Thanks Michael – good luck with your trading
Michael Upton
Thanks Mark – a very concise and clean explanation – a pleasure to read.
Mark Rose
Pleased you’ve found this helpful, and thanks for the feedback. I’ve been impressed with the MACD / Stochastic combination – is this what you’re using Paul?
Martyn Young
Excellent article Mark…well done in producing a much needed clearer explanation of indicators to use
Paul H
Very useful. MACD gets you in early when confirmed by a momentum indicator.
Mark Rose
Thanks for your comments – will definitely add CCI to my ‘to do’ list
Laurie
Thanks for another fascinating article Mark:)
Choosing a combination from the columns you’ve provided should give a more precise entry.
Underpinning that, support and resistance levels should help – and when we add the correct candlestick to the equation, it should be a good trade:) It’s all about probabilities though, and even then we are not guaranteed to get the result we expect. That’s where the stop loss comes in!
Also, as Julian asks, an article on CCI would be interesting too, if you have time?
Julian
hi mark, good article, could you do something about CCI.
Mark Rose
Kaz, Andrew, thanks for the feedback. Hope to do some more on stochastics soon – an indicator worth giving over some time to.
Andrew
Dear mark,
Thankyounforvthis latest Email,
Certain aspects are becoming clearer as how to look at support and resistance levels.
As in all things the more one becomes familiar the easier it is to understand. Your easy way of explaining is refreshing.
Regards Andrew
kaz
Thanks for the info Mark – really helpful. I’ve downloaded the price action book, too for some weekend reading!